

In this guide we will take you through a survey project. Spark Chart offers a high degree of flexibility and extensive customising features. To keep things as simple as possible, we will not cover all the features available.
By the end of this guide you will have:
- Installed a survey template from our library
- Launched a survey project
- Customised some branding options, including a logo, welcome page and colours
- Added a test participant and completed a survey
- Viewed a report and seen some of the filtering and customising options
First, some important terms
Survey template
Survey templates contain survey content (questions, headings, rich text instructions, page breaks and conditional logic).
You can install a ready to use survey template from our library or start with an empty survey template. Survey templates can be copied and edited. Survey templates are NOT survey projects.
Survey project
A survey project contains a copy of the survey template, survey participants and responses, customised branding and presentation, deployment options and reports.
When a project is launched, the survey template is copied into the project and a dedicated project space with project specific menus is created. In the project there are dedicated menus to customise the branding and presentation, deploy surveys and create reports.
Let's Get Started!
In this guide we will start with a survey template from the Spark Chart library.
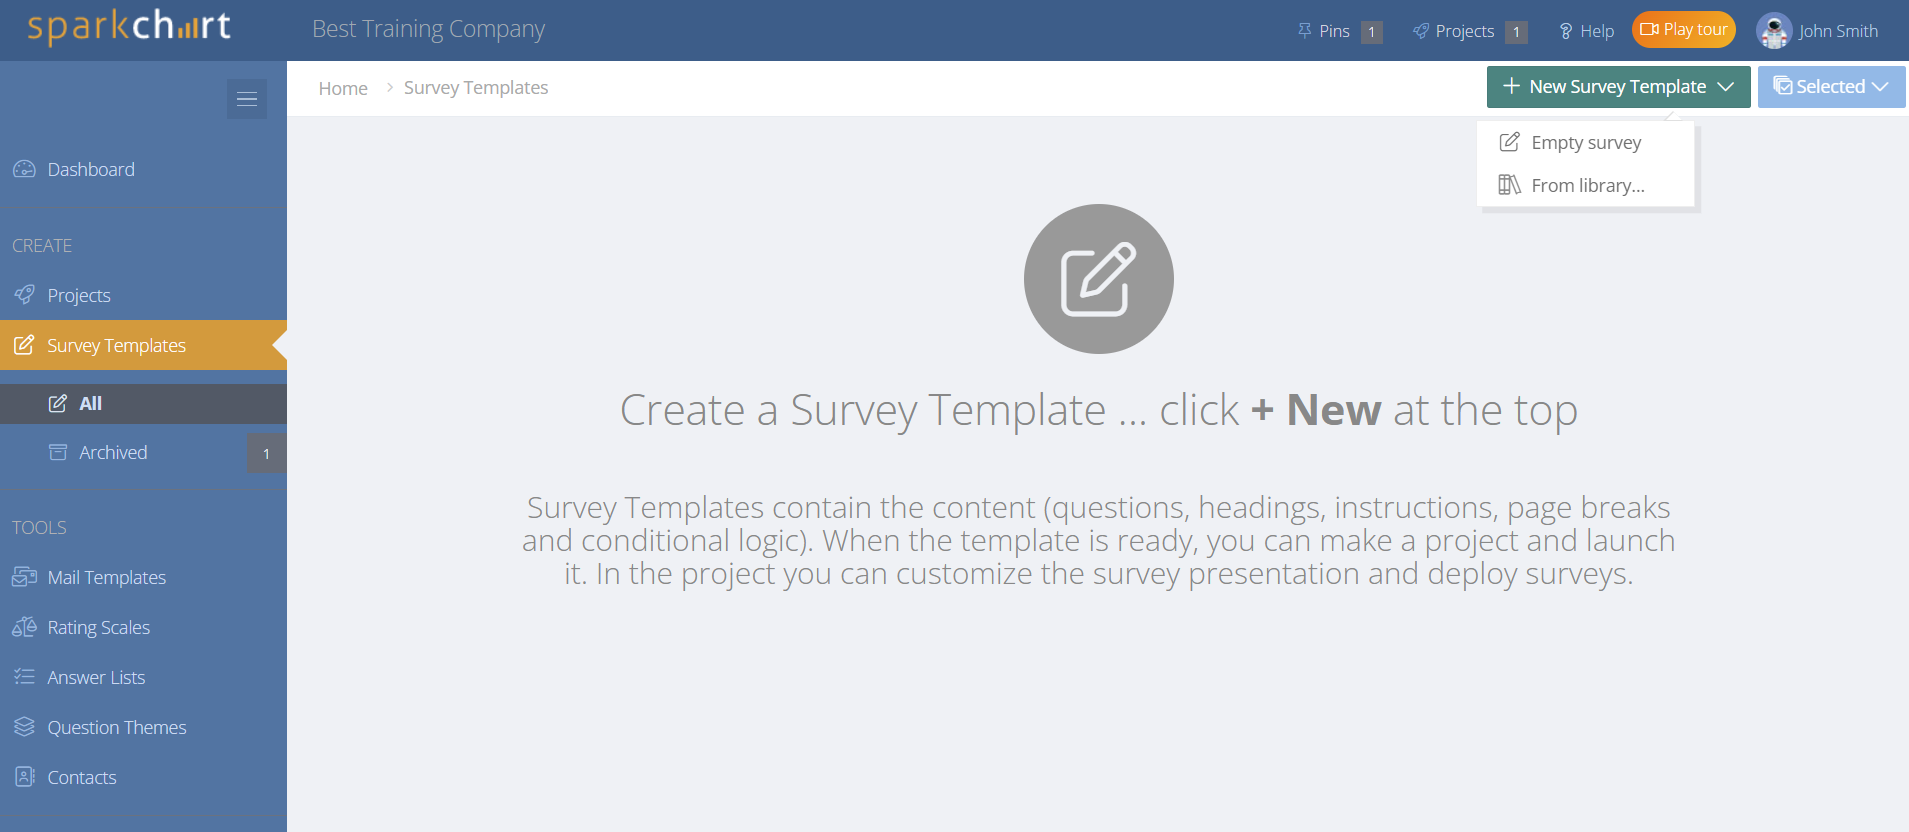
Step 1: Install a survey template from the library
Go to Survey Templates in the side menu and then click the + New Survey Template button at the top right. Select "From library". You can use any survey template with this guide.
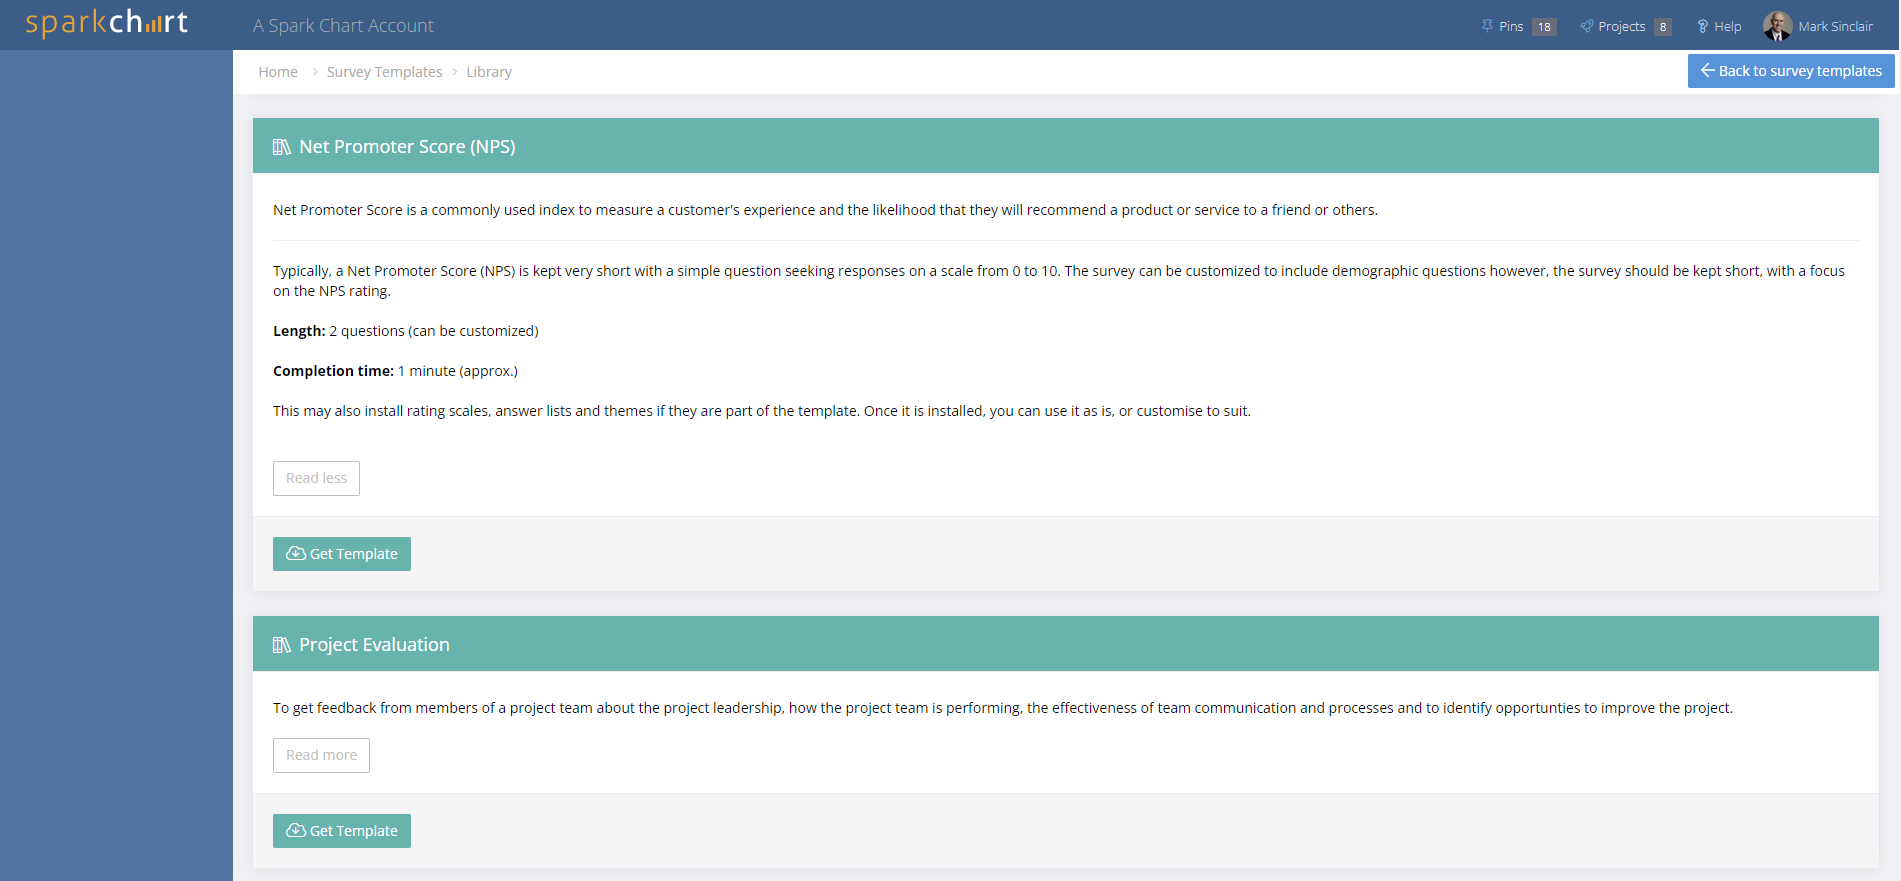
Select a survey template that most closely matches your use-case. Click Read more for an outline of the survey template content. For your chosen survey template, click Get Template.
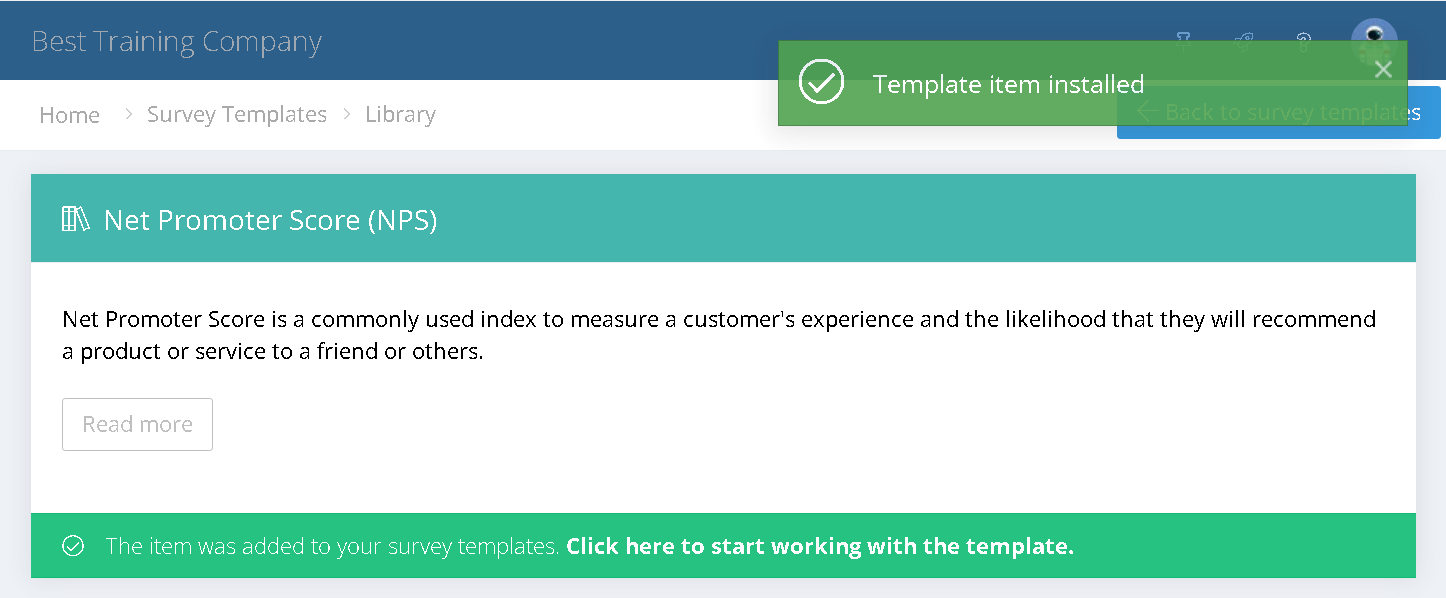
 You will see a confirmation that the survey template has been installed. Click the Back to survey templates button and you will see your survey template listed.
For this quick start guide, don't modify the survey template.
Step 2: Launch a project
Remember, a survey project is where you add the survey template, customise the branding and presentation, deploy surveys, create and share reports, and analyse results.
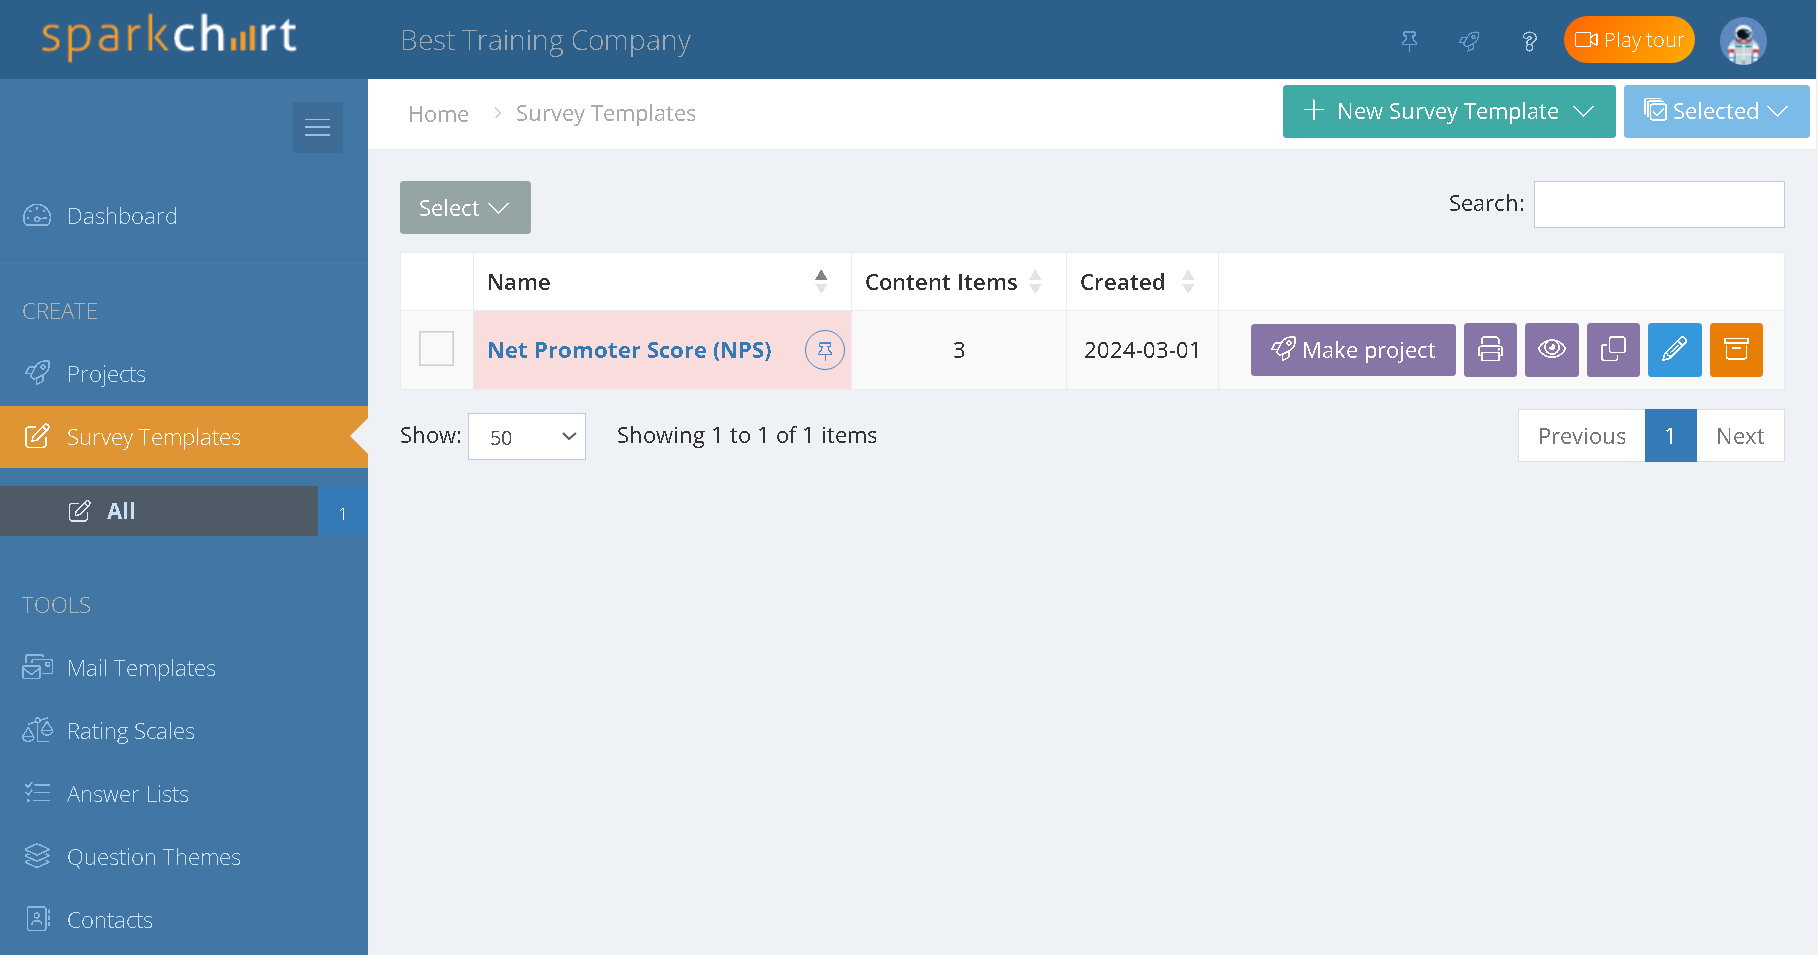
From the Survey Template page, click the Make Project button alongside the survey template.
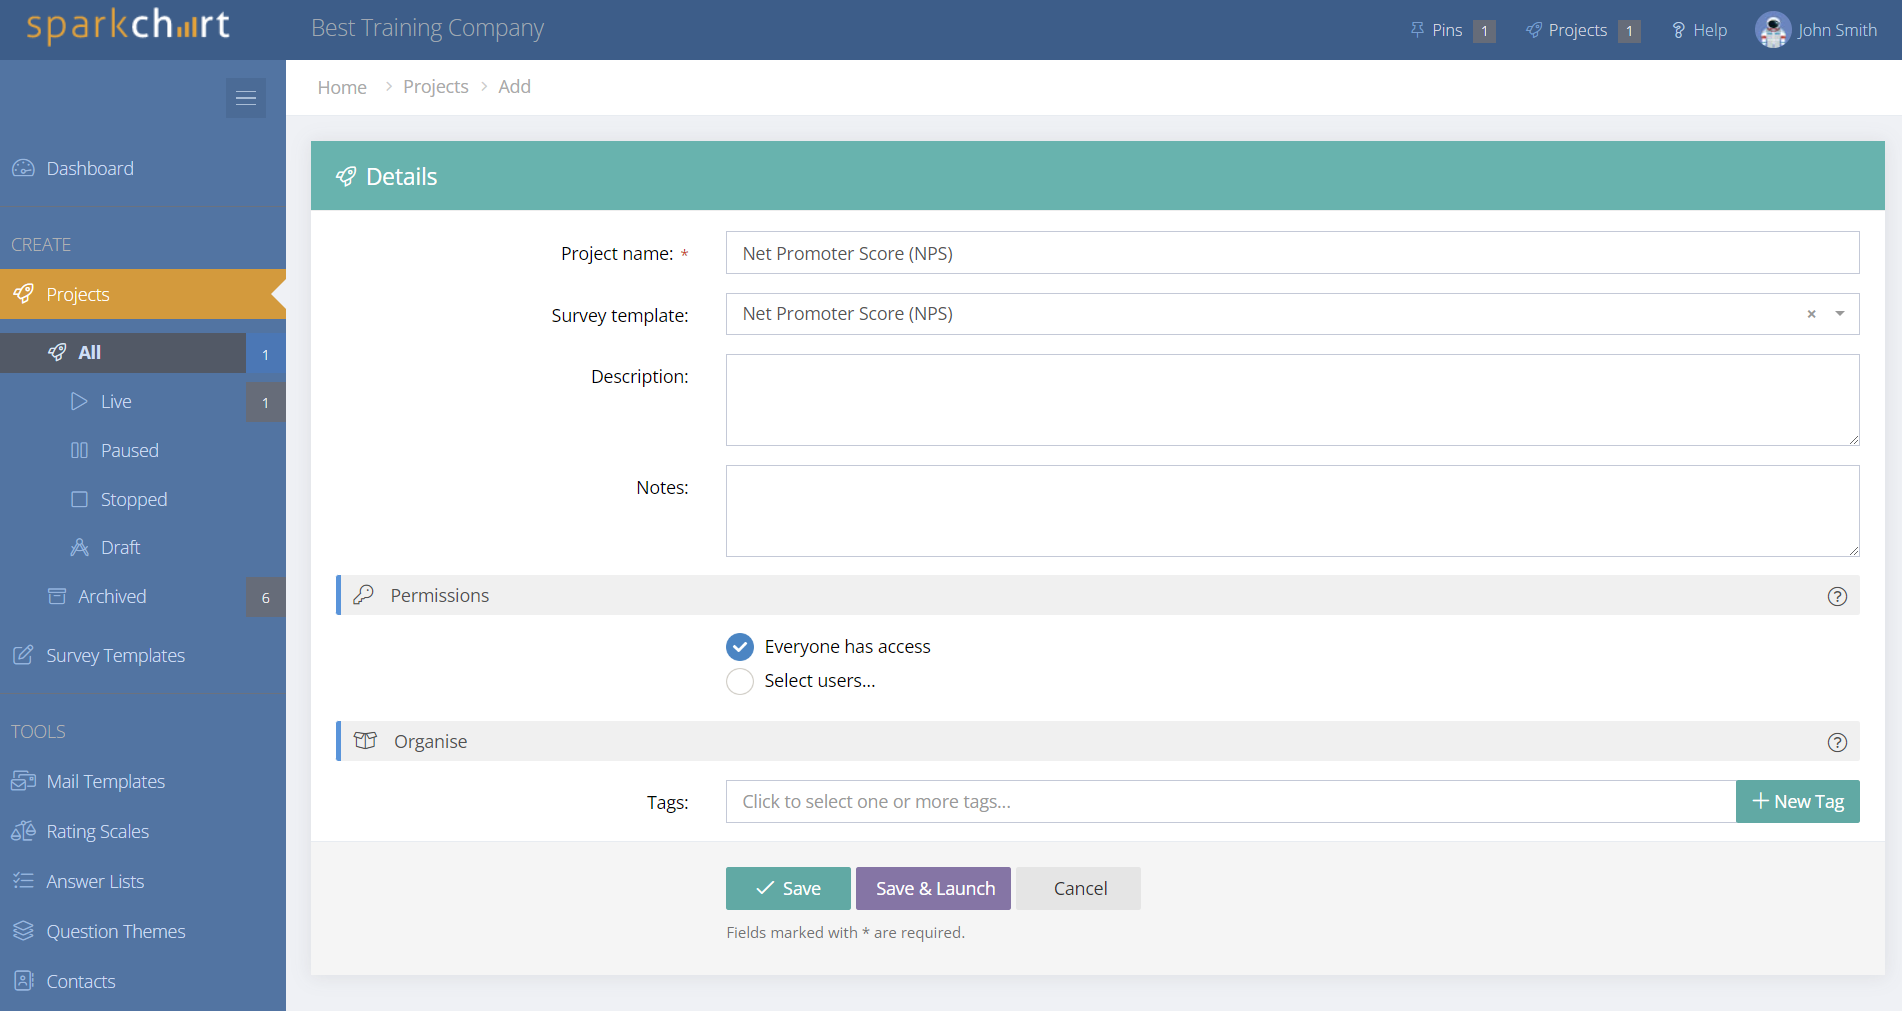
You will see your new project details. Change the project name if you prefer. Click Save and the project will appear under the Projects menu.
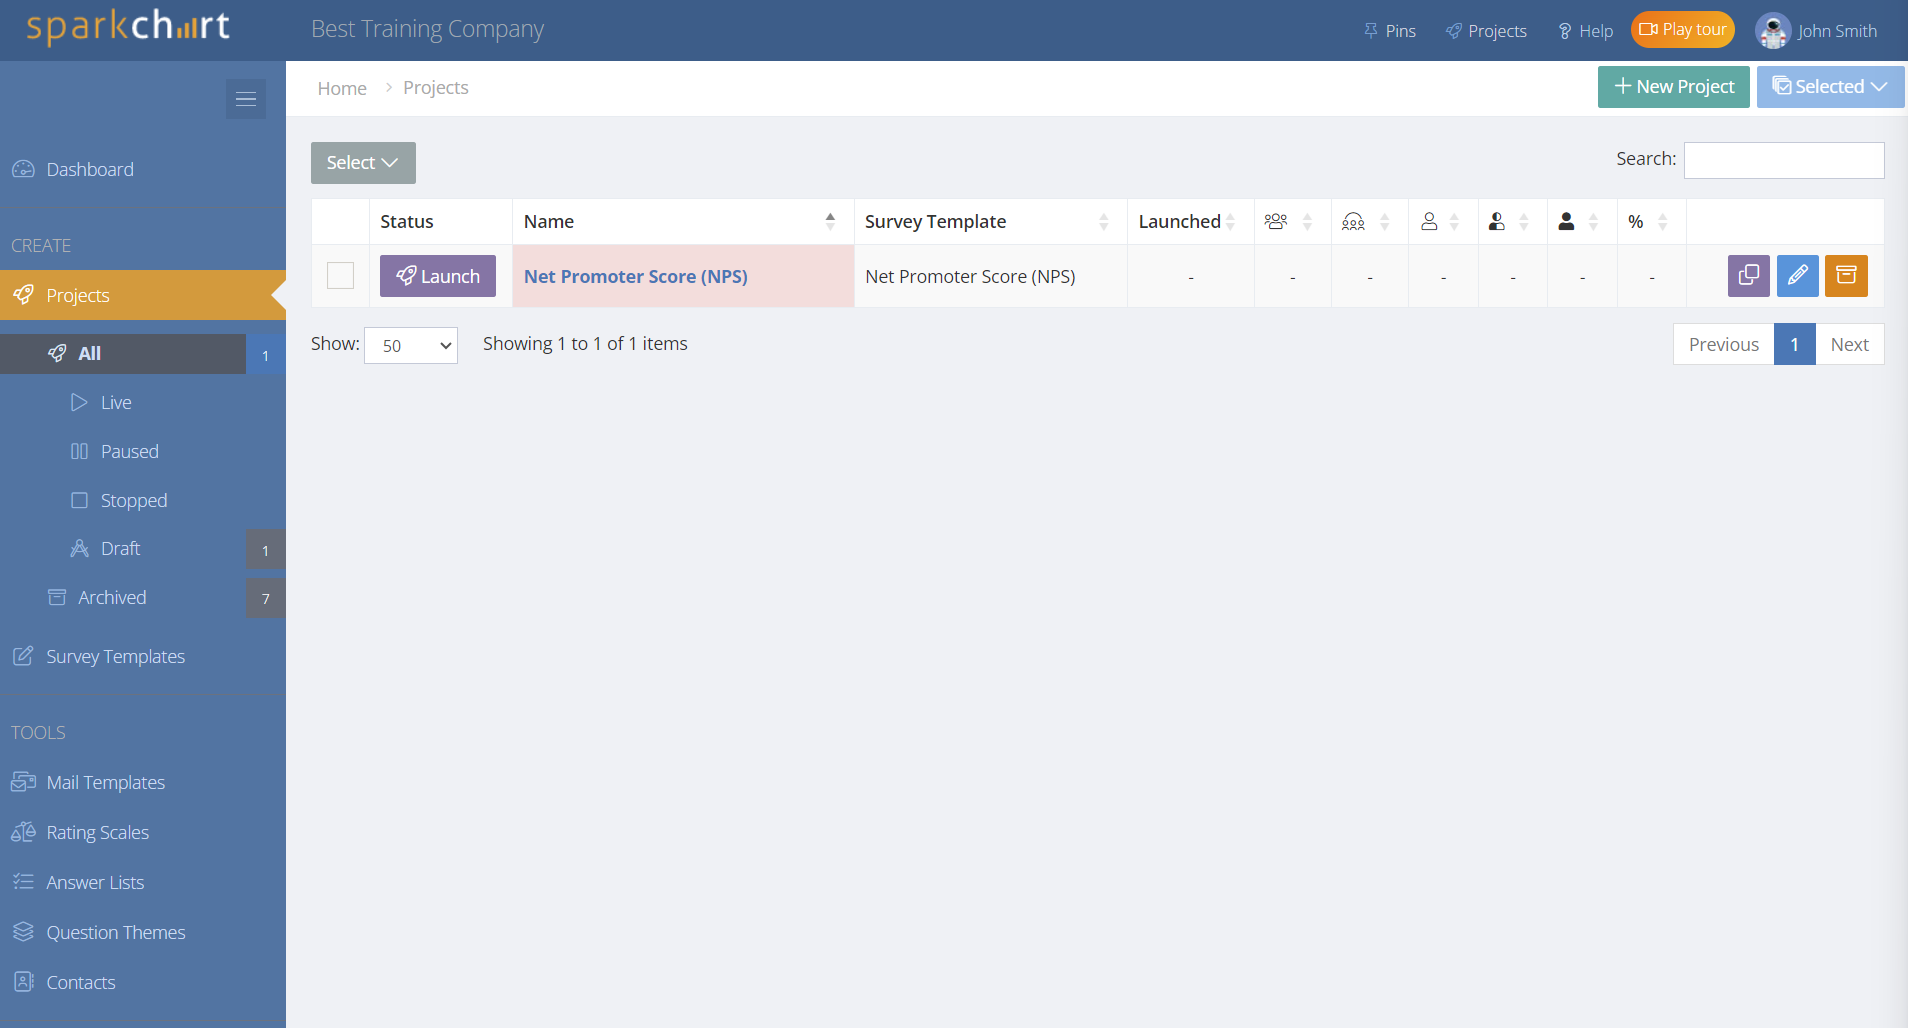
Click the Launch button alongside the project name.
Are you ready? Confirm by clicking the Launch button to continue. The launch process will begin and the survey template will be copied into the project.
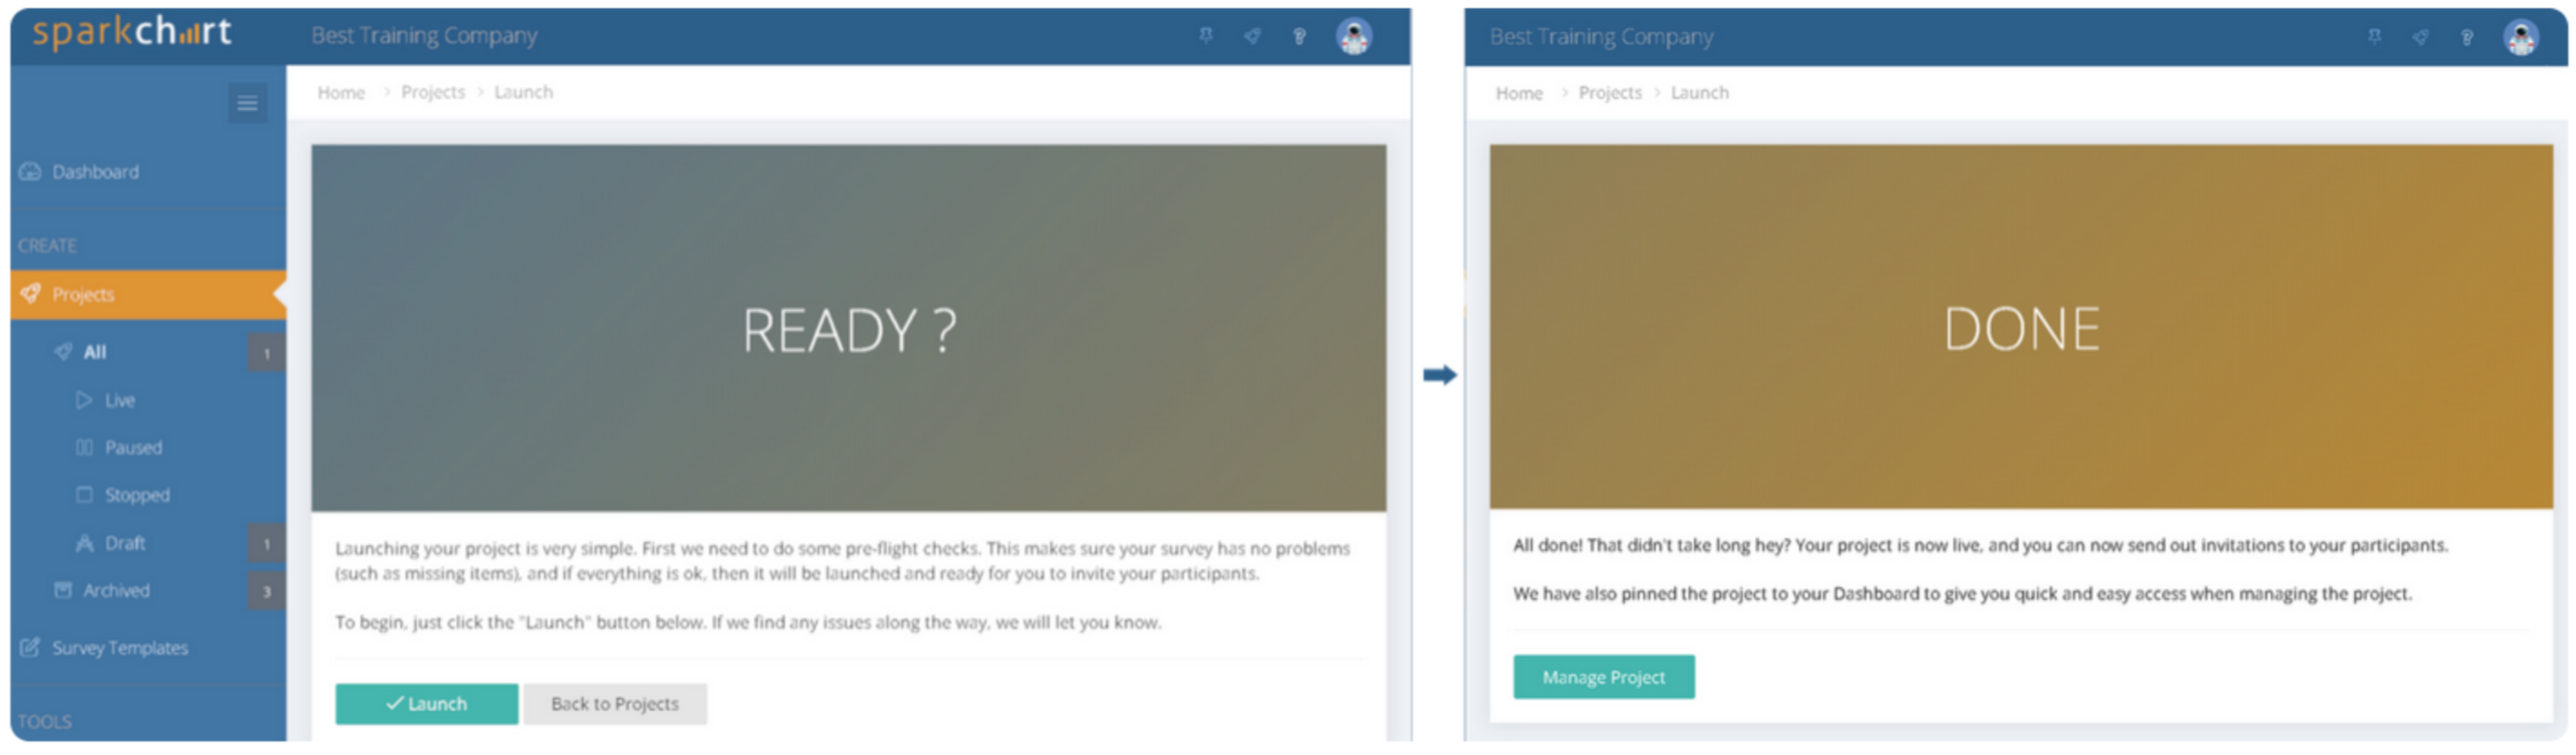
When finished, click the Manage Project button to see the Project Dashboard and dedicated project menus.

Well done! Your project is ready to customise the branding, test and pilot, deploy surveys and create reports.
Quick tip
Look for the Pins icon in the top menu bar. Pins provide shortcuts to move between projects, survey templates and reports.
Step 3: Customise some branding and presentation options
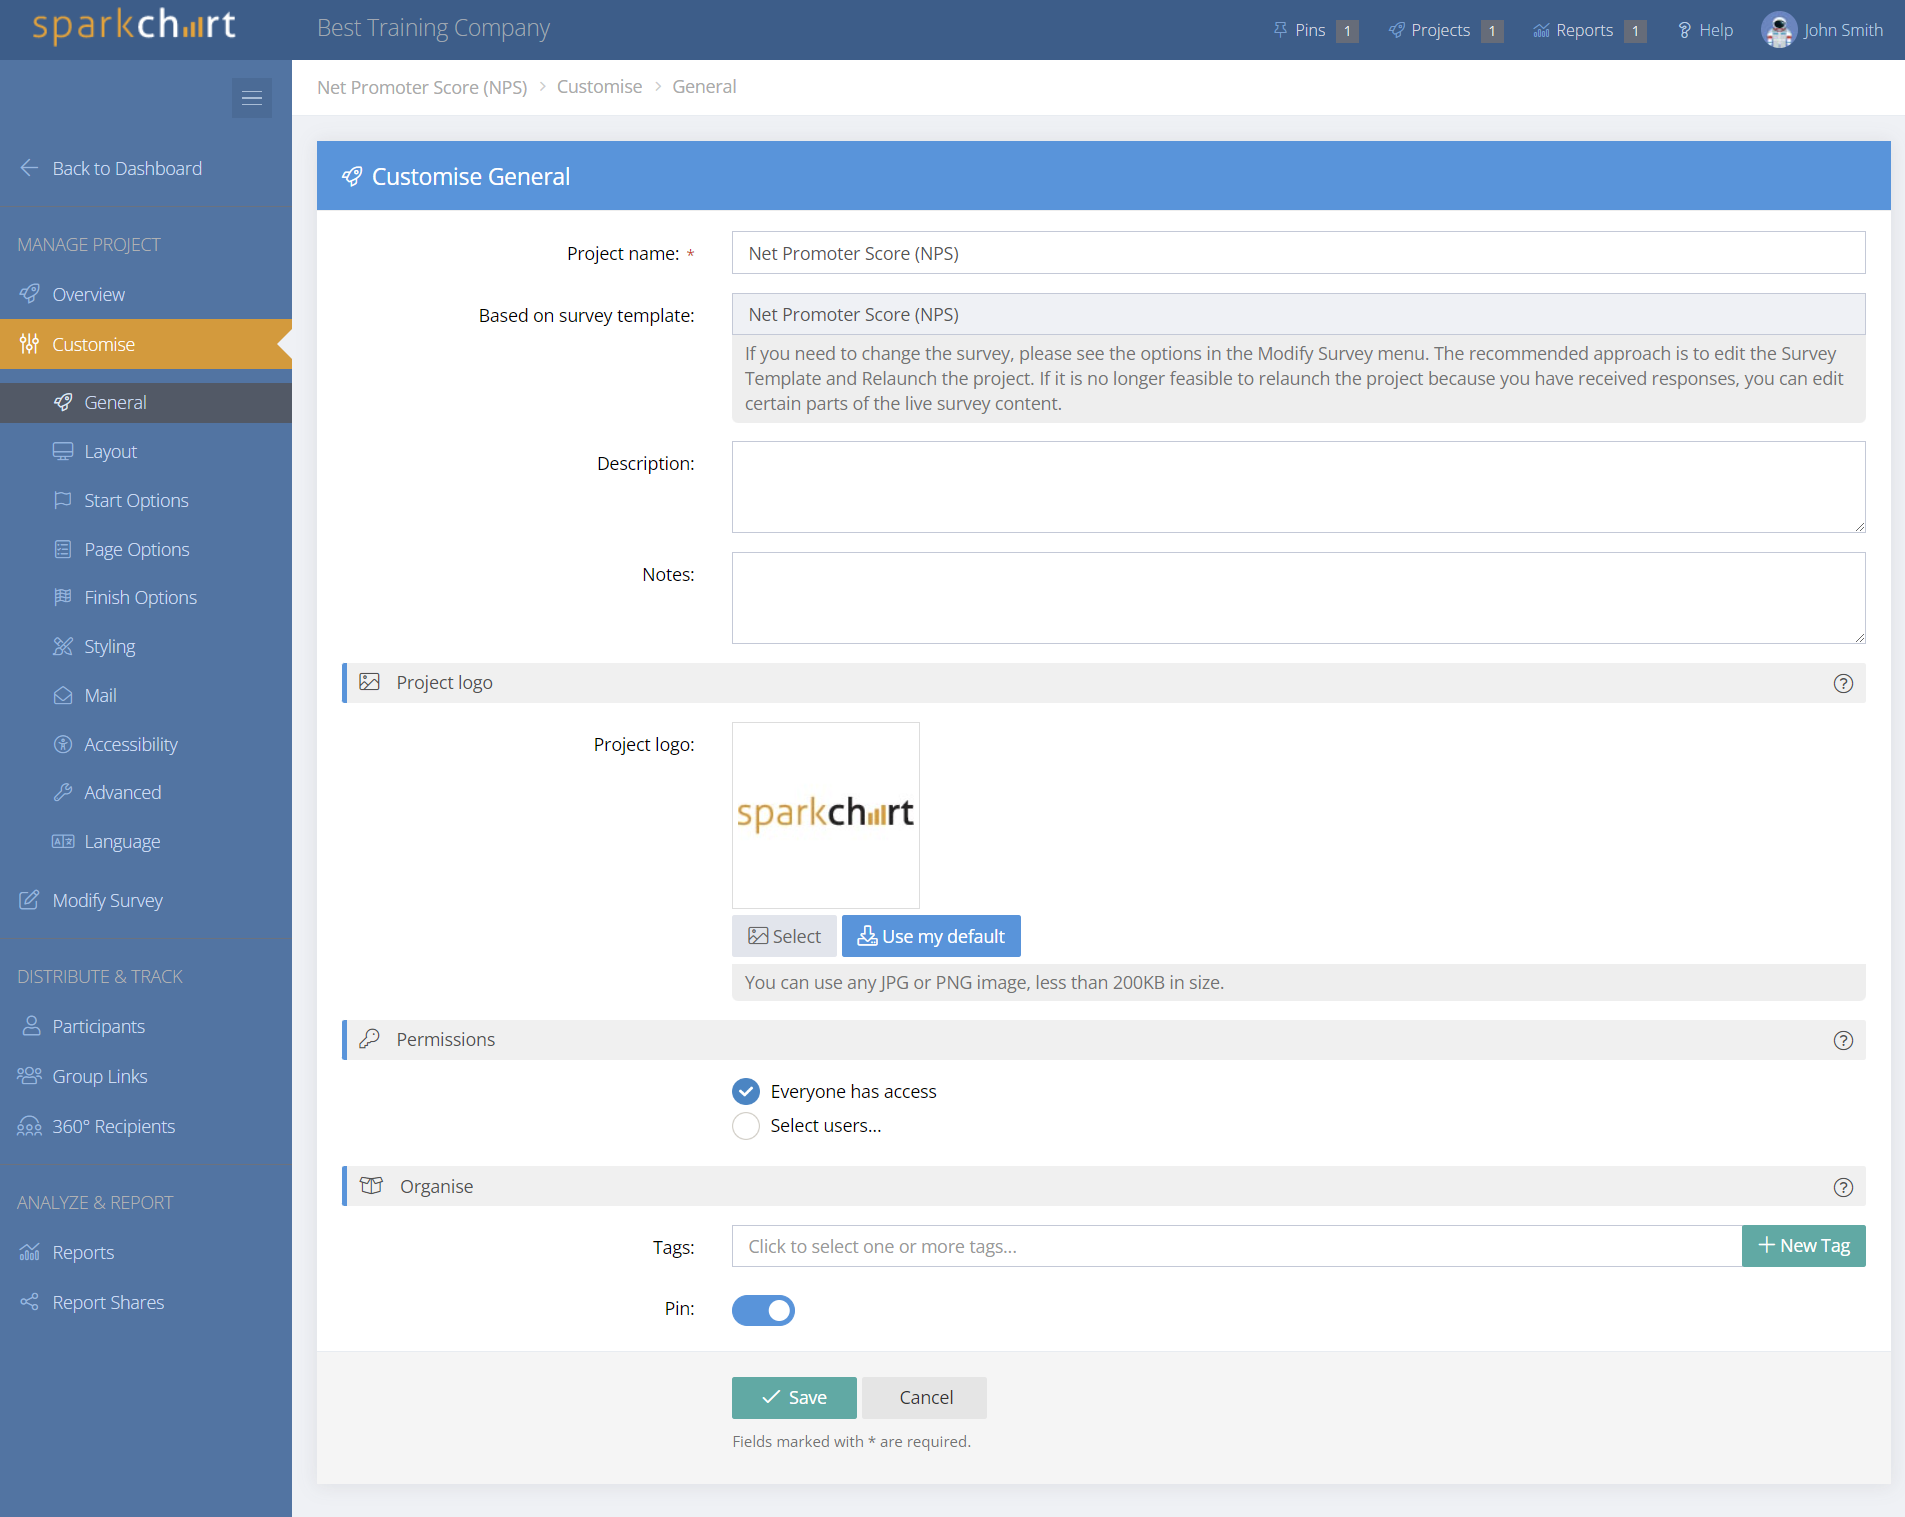
In the project there are many customising options under the Customise menu. Start in the General page and progressively move through each of the Customise Sub Menus. Today, let's just customise just a few options - a logo, welcome page and colours.
Add a logo
Go to the General page and add a project logo then click Save. The logo can be any image - like an organisation logo, or a project related image.
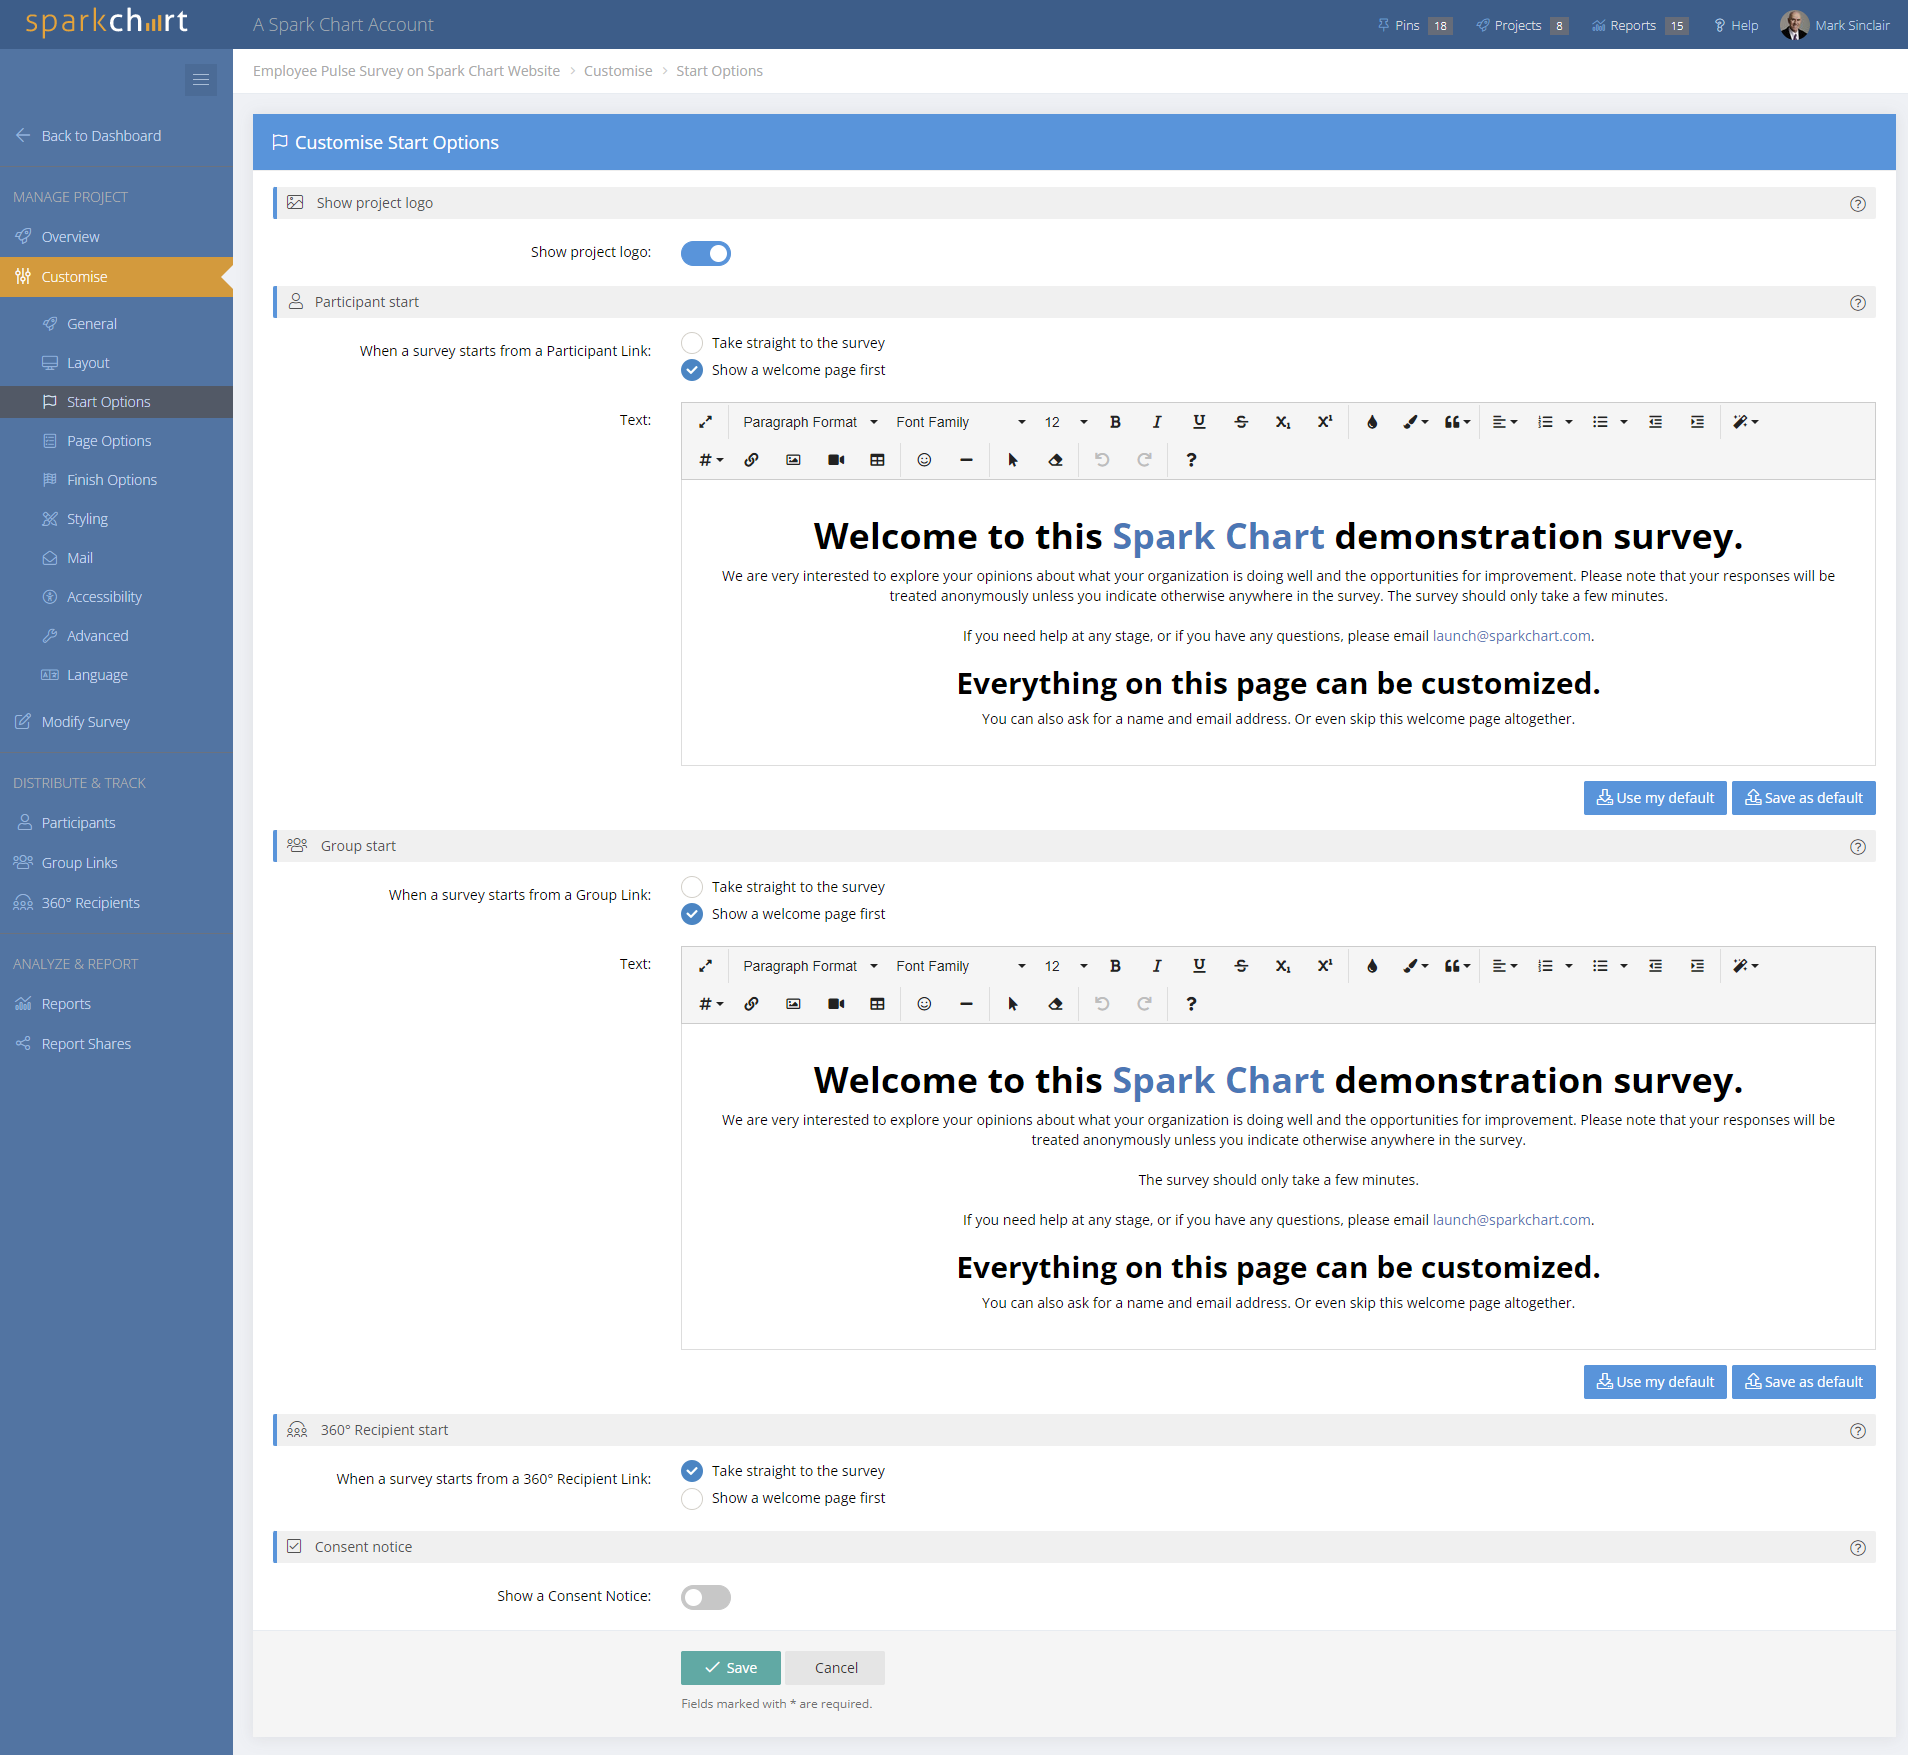
Add a Welcome Page
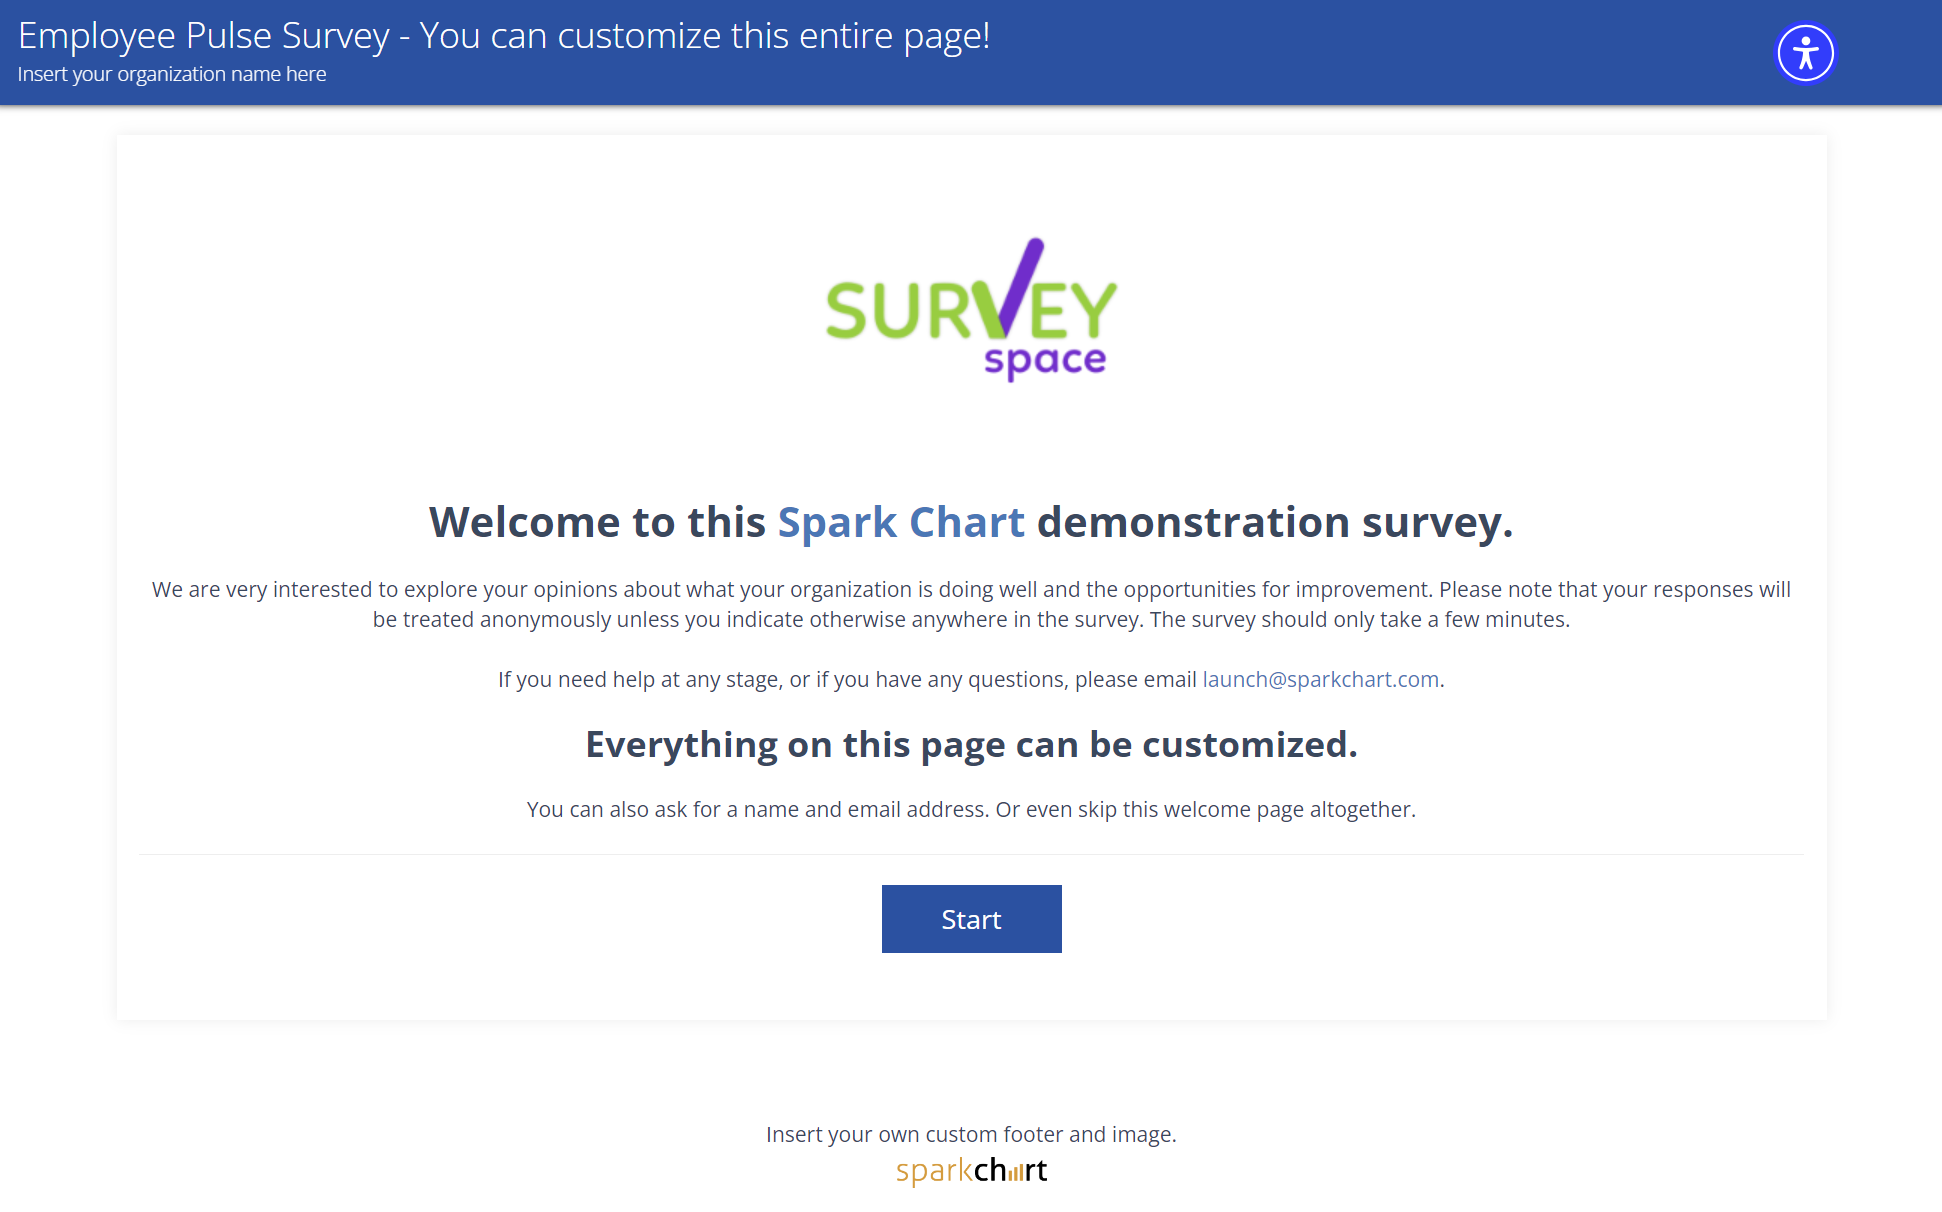
Next, move to the Start Options sub menu. When someone starts a survey, you can control whether they see a Welcome page or go straight into the first survey question. A welcome page enables you to present an introductory message and instructions, along with a Start button, to your survey particpants.
By default the Show a welcome page first is deactivated. Enable the Show a welcome page first button to open the rich text form, add a welcome message and click Save.
Quick tip
There are different Welcome page options depending upon the deployment type selected. For now, we have focused on just one type of welcome page.
Quick tip
Click on any of the grey bars with any heading to reveal help instructions for the sub section.
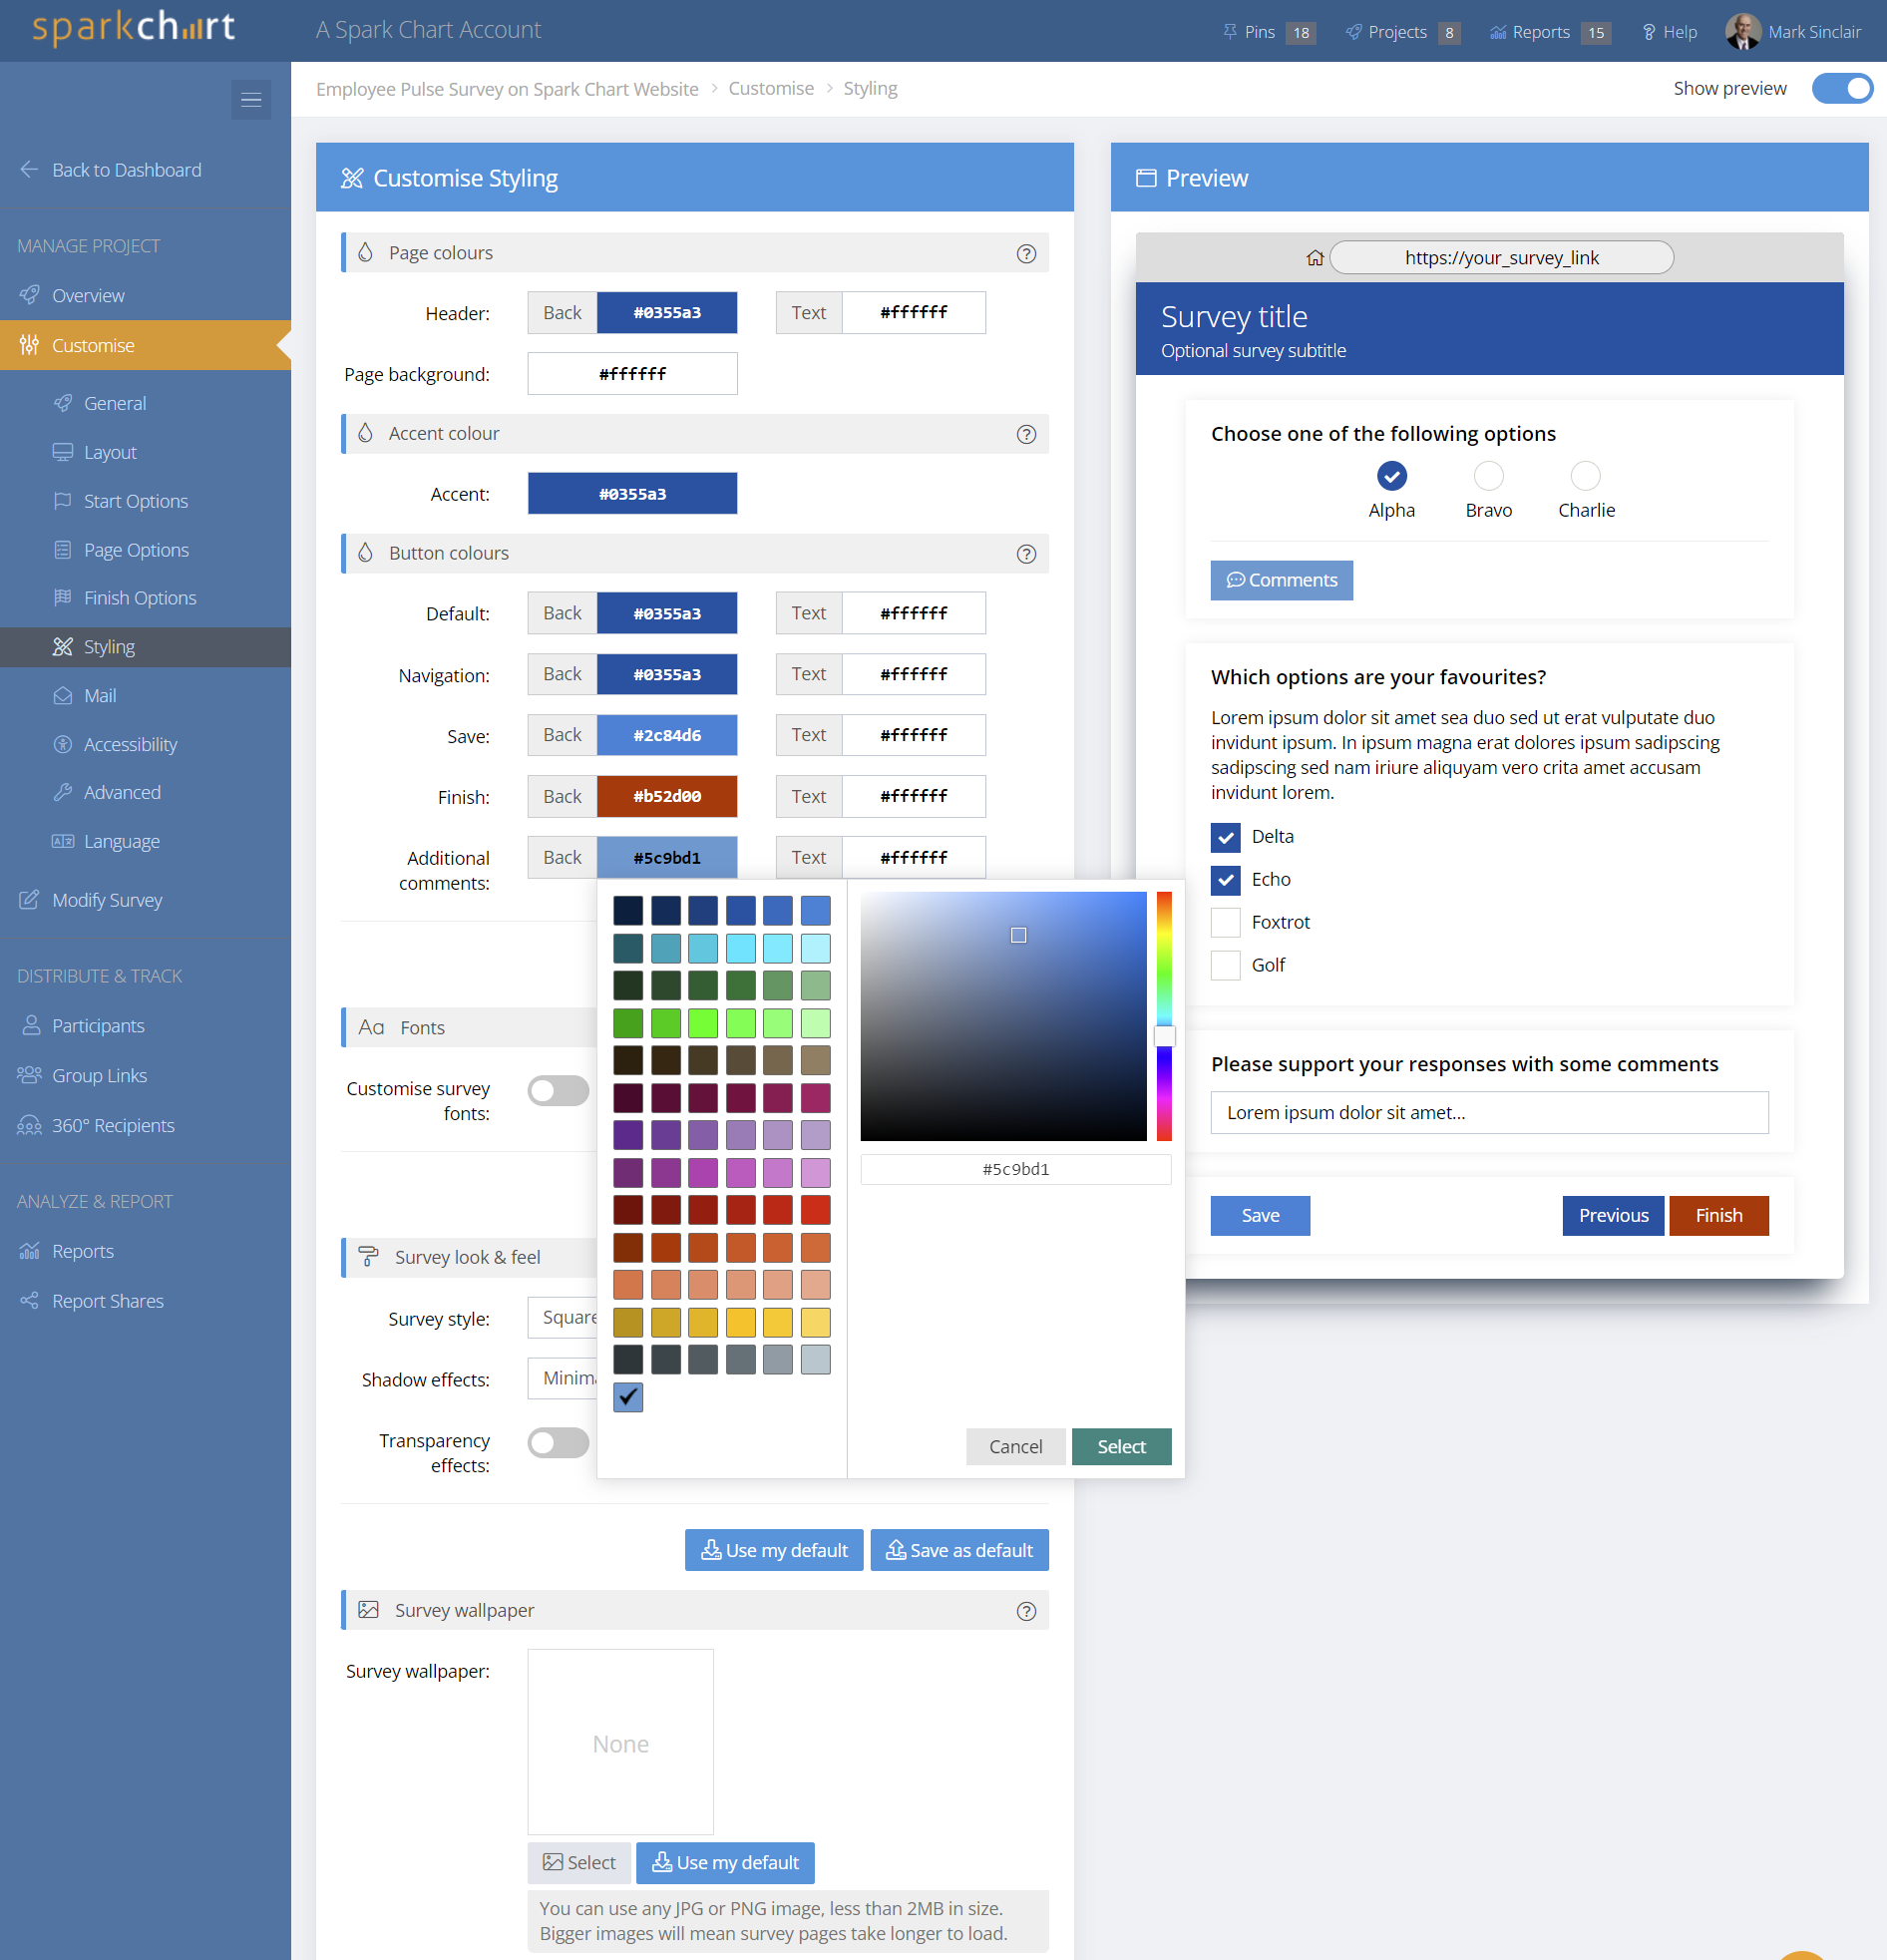
Customise the colours
Colour options in Spark Chart are extensive. Click on Customise Styling sub menu. You'll see the styling page with colour, font and other options. The Preview section on the right of the page will update to provide an example of the selected options.
Make sure to scroll down to the botton of the page and press Save.
Quick tip
The customise options can be updated at any time and will appear immediately in a live project when saved.
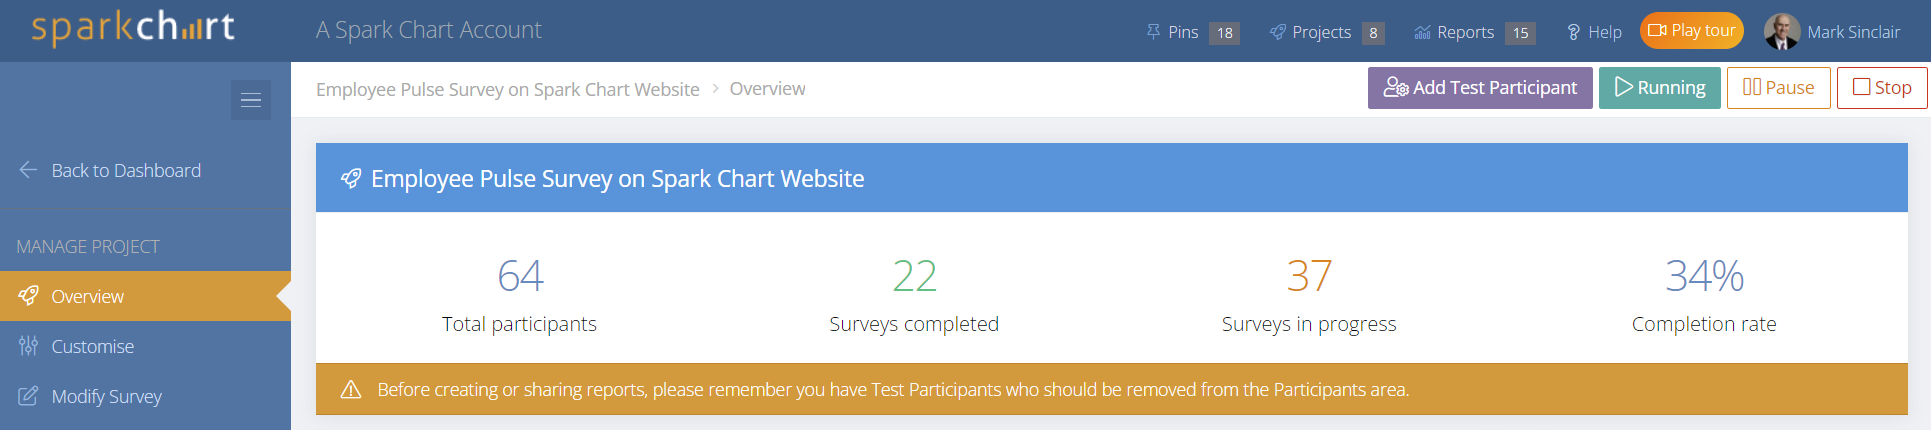
Step 4: Add a test participant and complete a survey
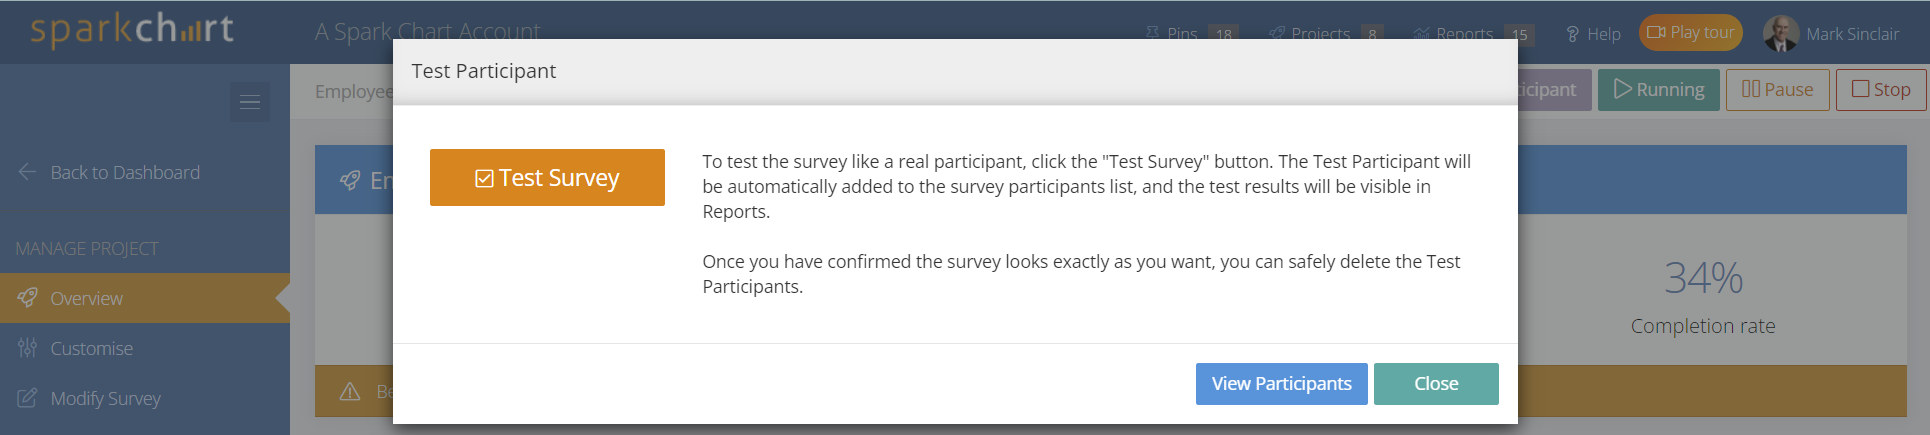
To test your survey and the customised changes you have made, go to the project Overview page. Click the Add Test Participant button at the top right and then click Test Survey.
The survey will open in a new browser tab and you will see your customised survey welcome page. Click Start to begin the survey.
When you click Finish on the last page you'll see a default Thank You page. The text and styling on the Finish page can be customised in the Finish Options menu at a later time.
Now go back to the Spark Chart software and go to the Overview menu to add further test participants. This will give you more results to see in reports.
5. View a report and filter results
In a report you can filter results, customise presentation layouts, choose different chart types and colours, add messages or recommendations, show or hide report elements and more.
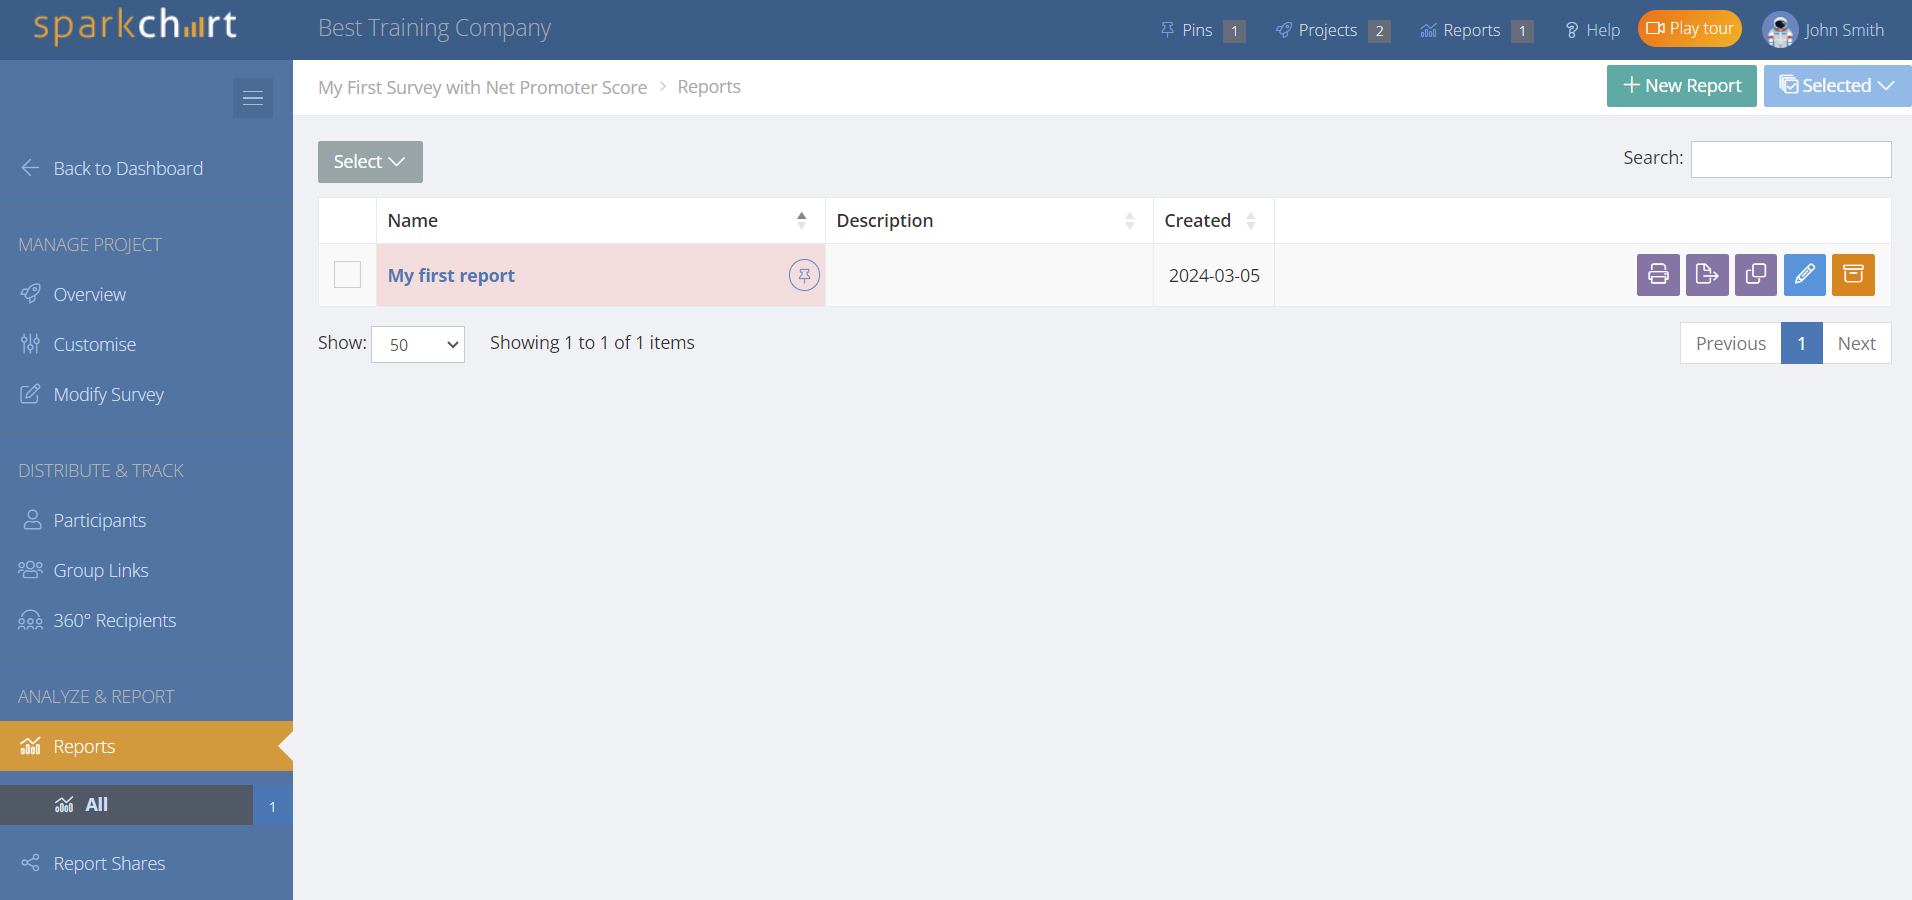
Go to the Reports menu and you will find that your first report has been generated automatically. if you wish, select the + New Report button to create a new report.
Quick tip
Alongside any report is a purple Copy icon. Click that to create an exact copy of the selected report, rename it, and then customise.
Click on the report name or the Edit icon to open a report.
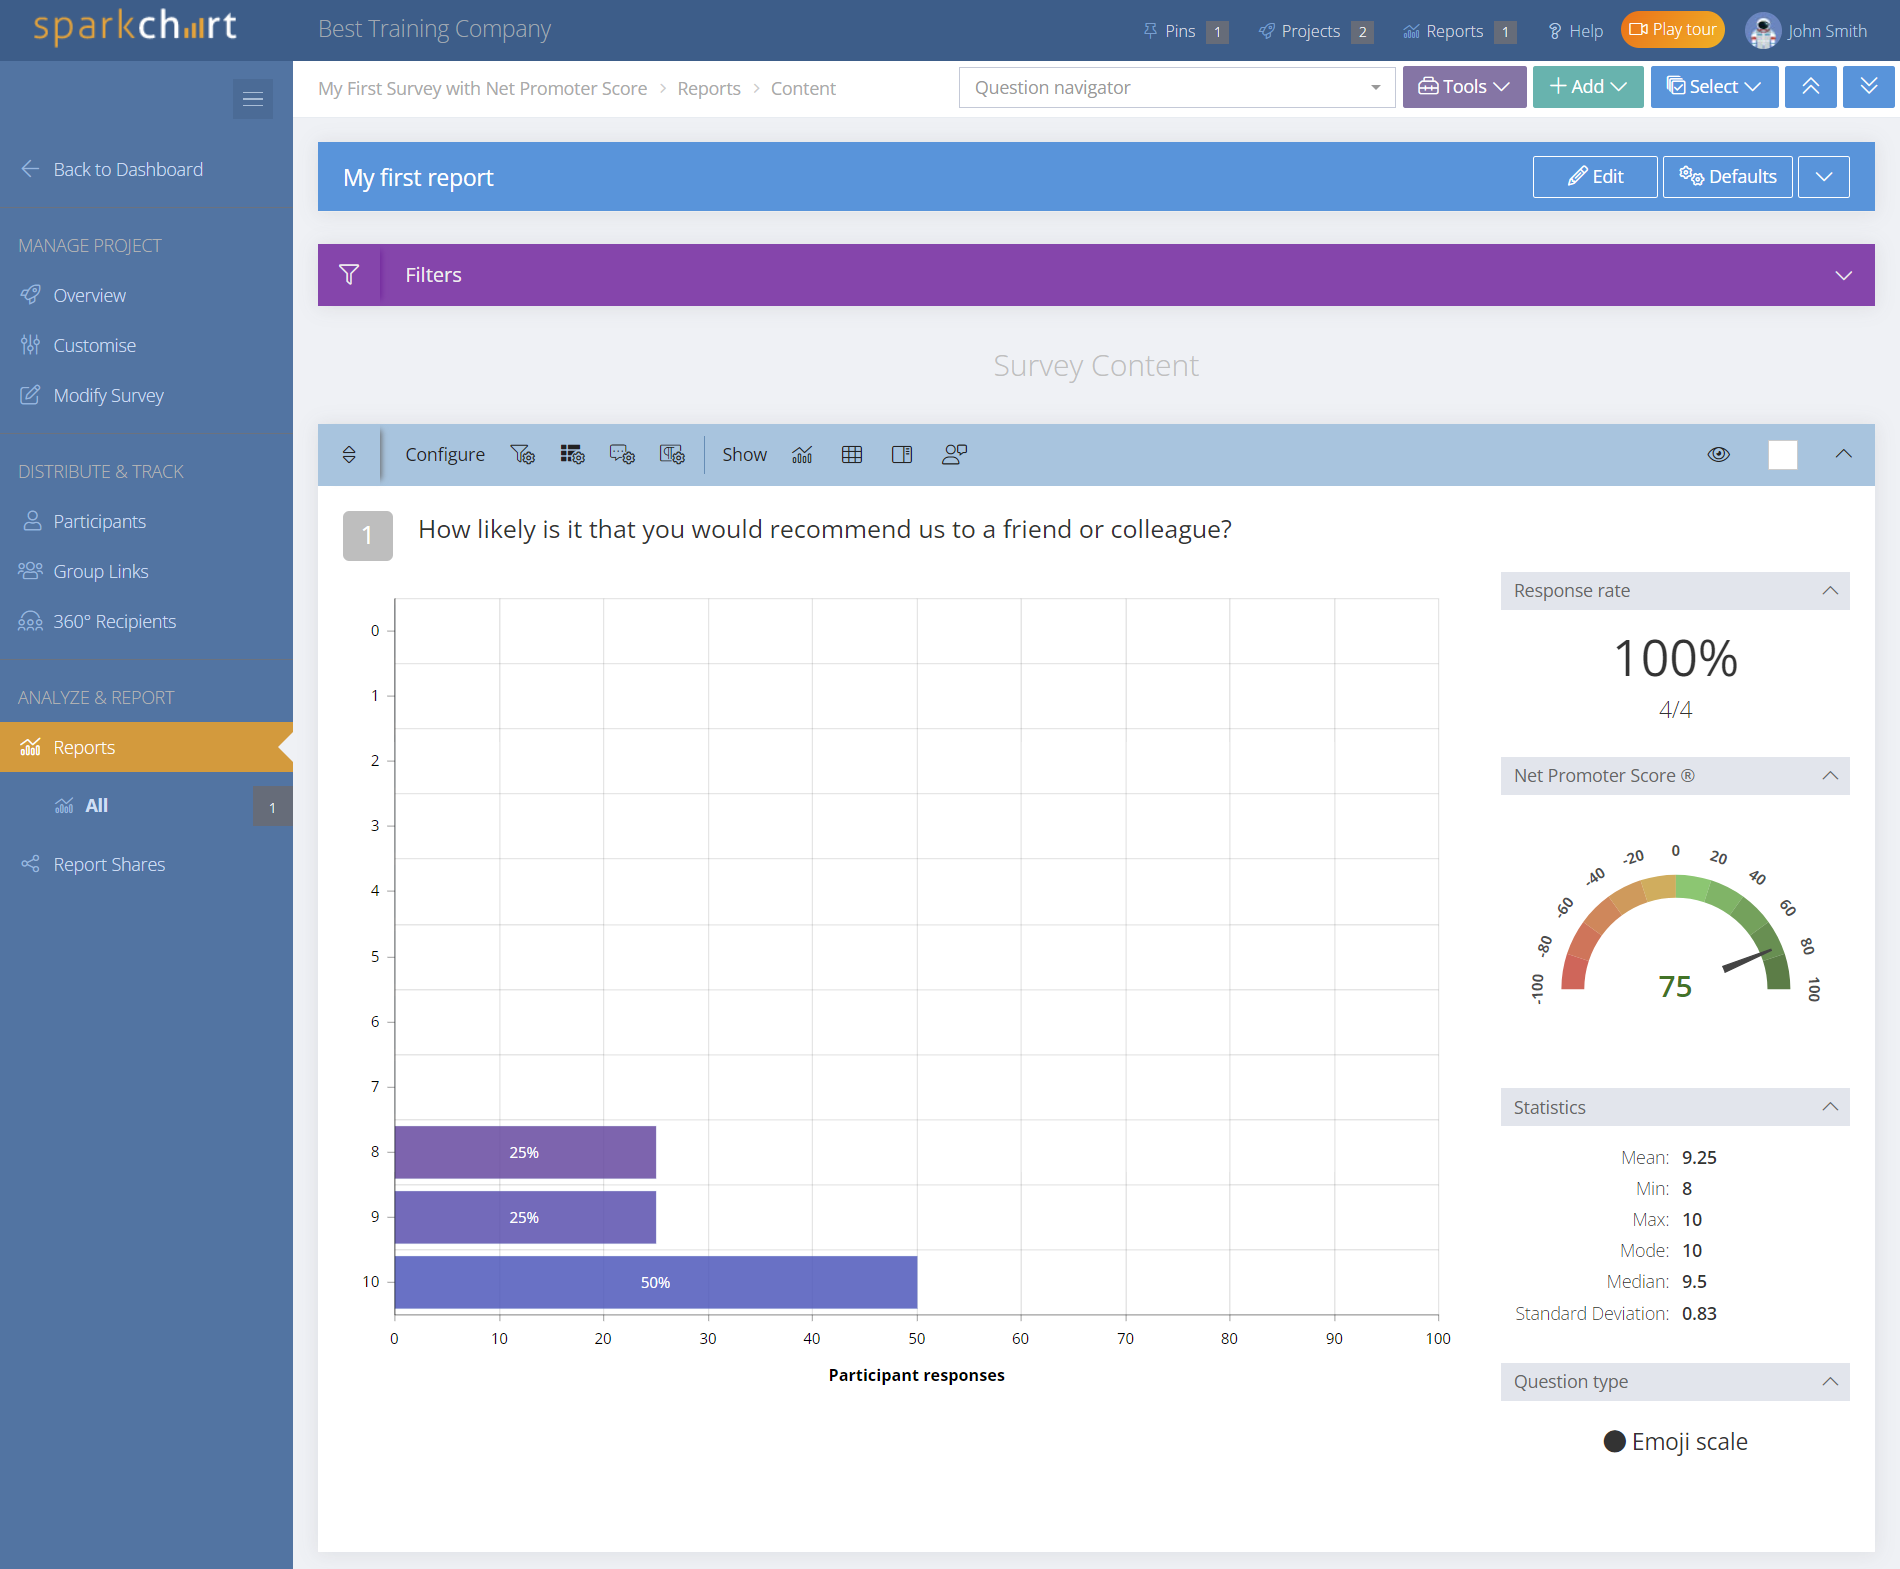
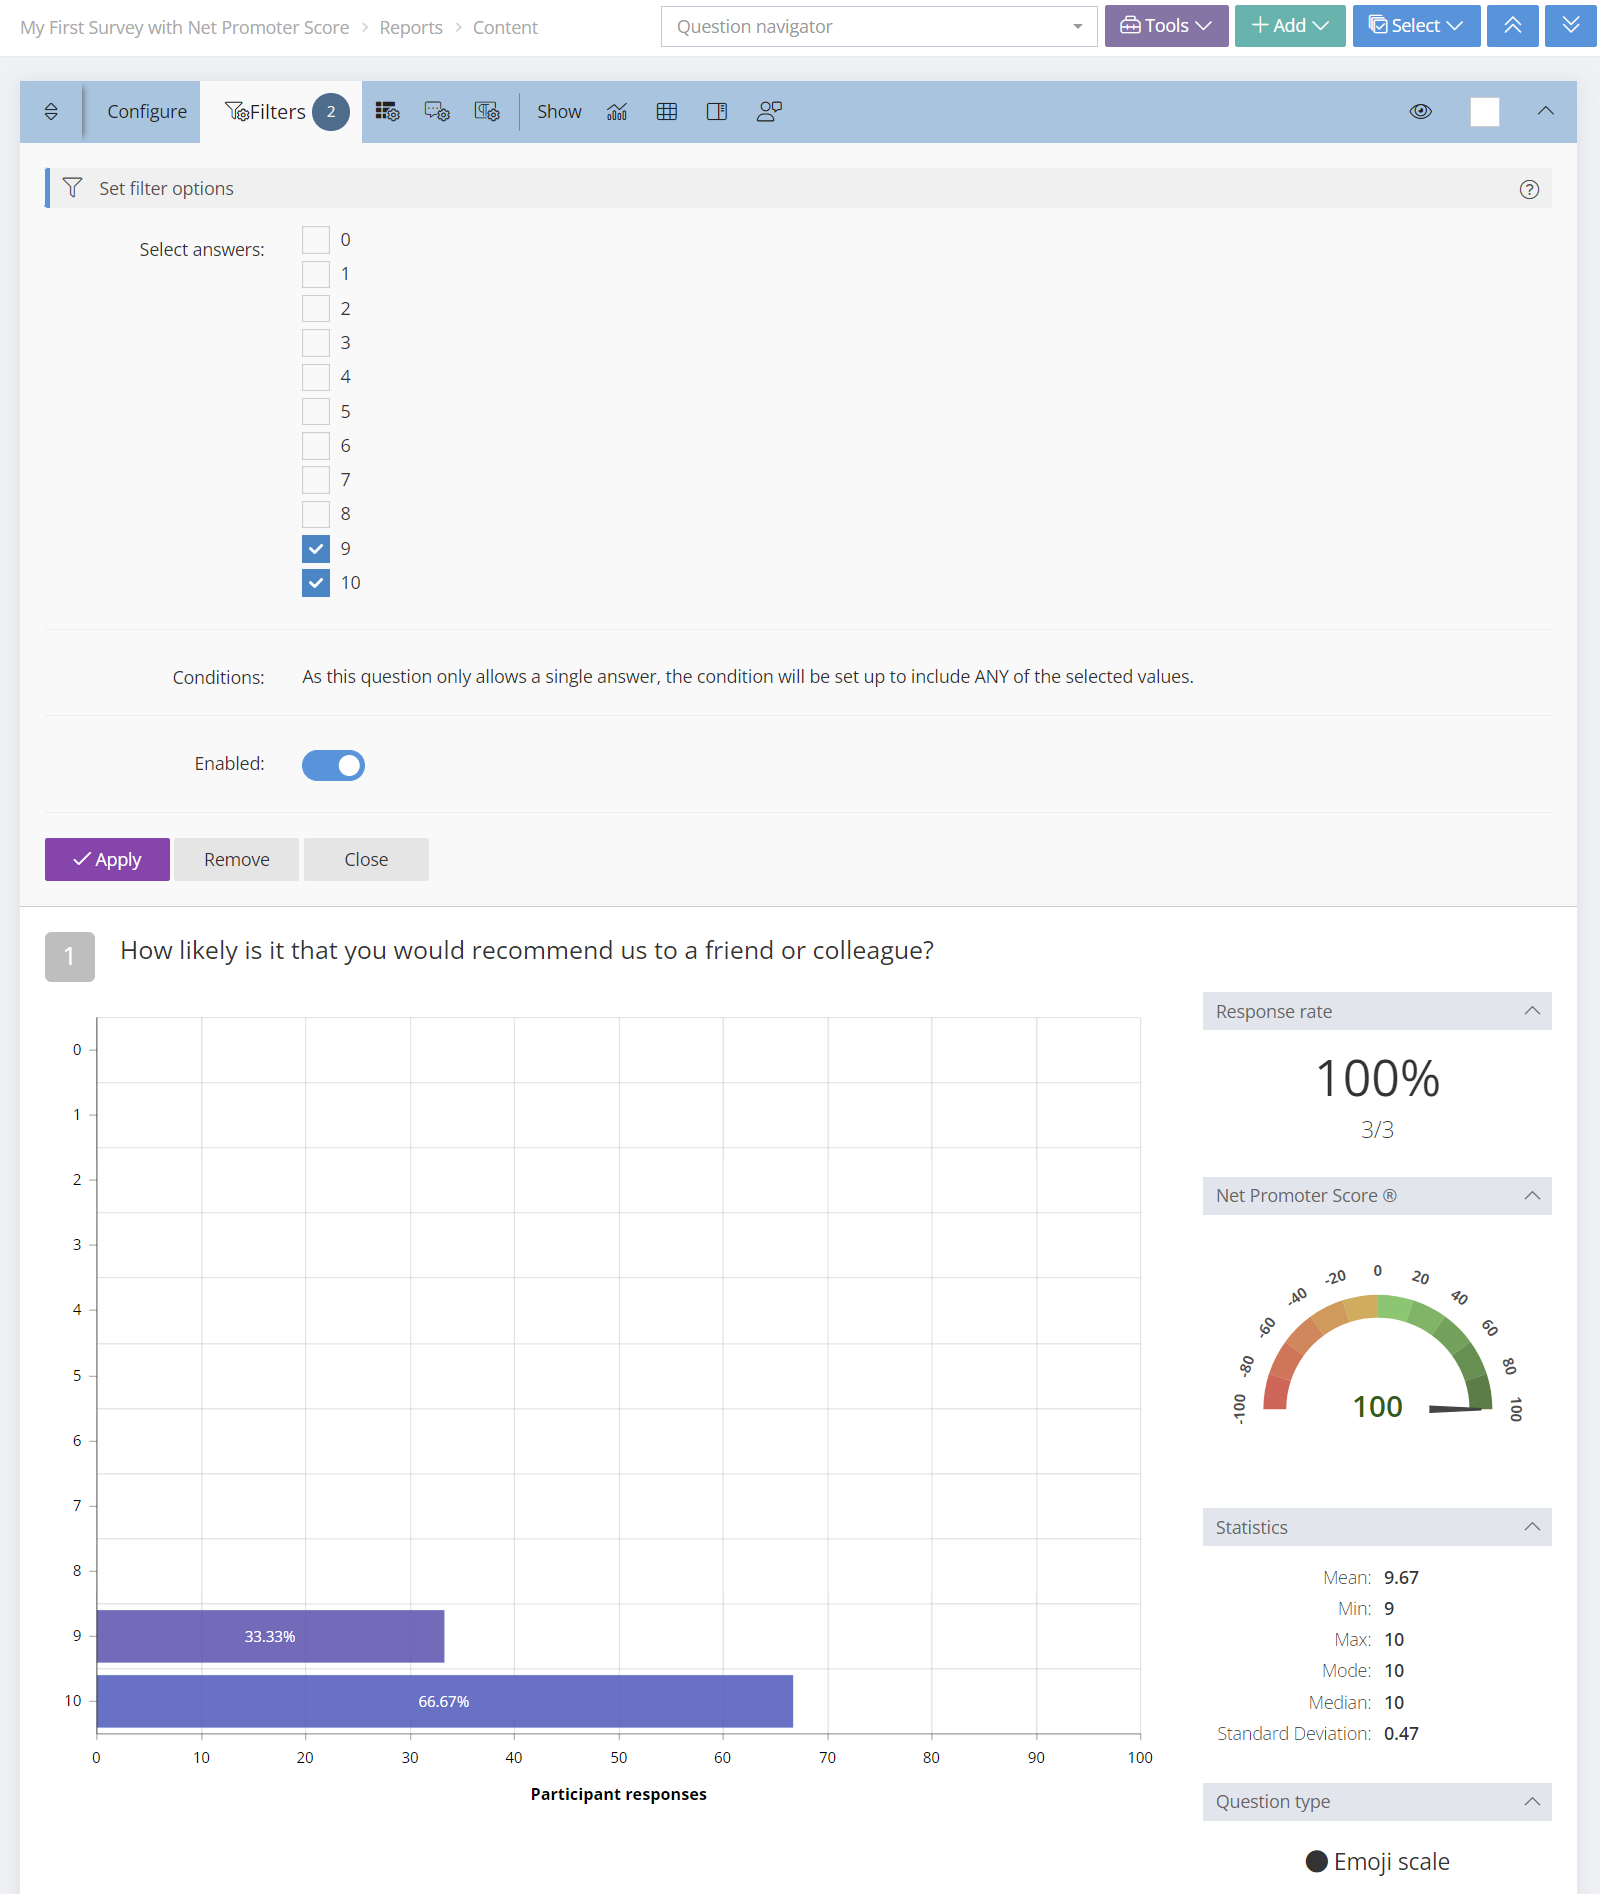
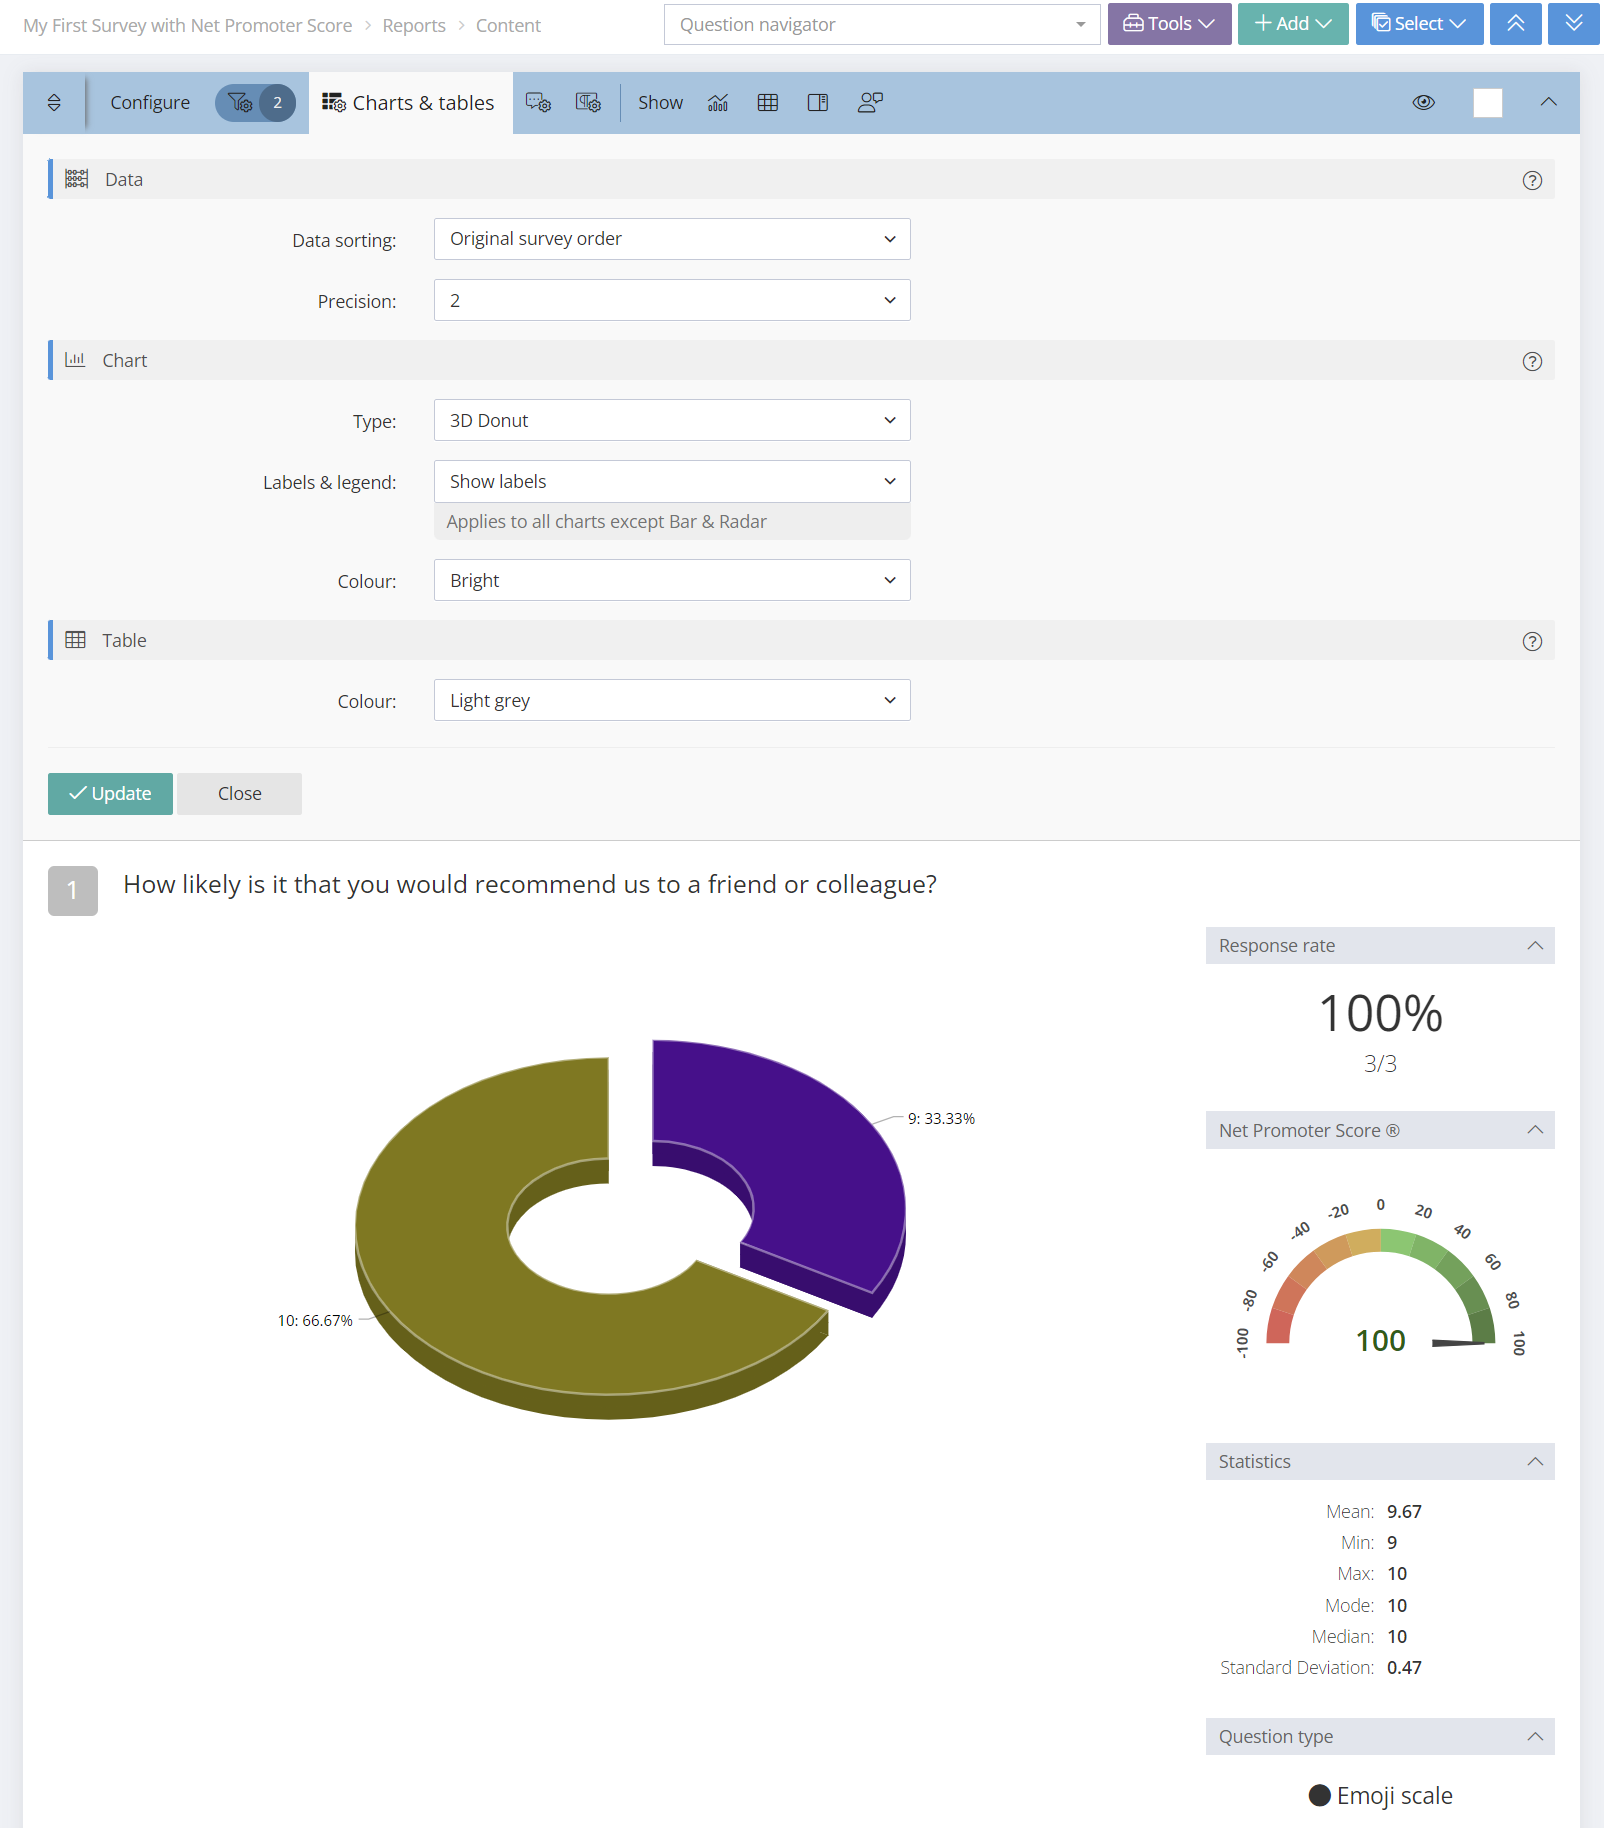
Above each question and chart in the report is a blue tab with options to Configure the Filters, Charts & Tables, Data settings, Comment settings and insert rich text, images and videos into the report. There is also a Show area to hide or show selected elements.
A couple of examples of the options (Filters and Charts & Tables) are illustrated below. The options will vary depending upon the question type.
Quick tip
There is a Defaults button to customise defaults for what is displayed or hidden, chart types and colours, the visibility of individual responses and free text responses and more.
Create as many reports as you need. You can also copy reports and then edit (so you don't lose previous work and analysis).
Quick tip
The Share Reports feature provides an easy way to share reports and present survey results. There is also a unique option to allow people viewing the shared reports to filter the responses.
There are many report options to explore.
You’re on your way!
Thanks for following this quick start guide.
We are here to help, so please contact us if you have any questions or need support.
Quick tip
Help is available in many ways. Look for the Chat icon in the software, there is a link to our Help Center at the top of each page and there are tips in the grey bars throughout the software. Alternatively, you can email support@sparkchart.com.
Help is available in many ways. Look for the Chat icon in the software, there is a link to our Help Center at the top of each page and there are tips in the grey bars throughout the software. Alternatively, you can email support@sparkchart.com.