We are currently preparing a major update to Spark Chart (you will love it), but in the meantime we wanted to share a new reporting feature with everyone.
New report filters
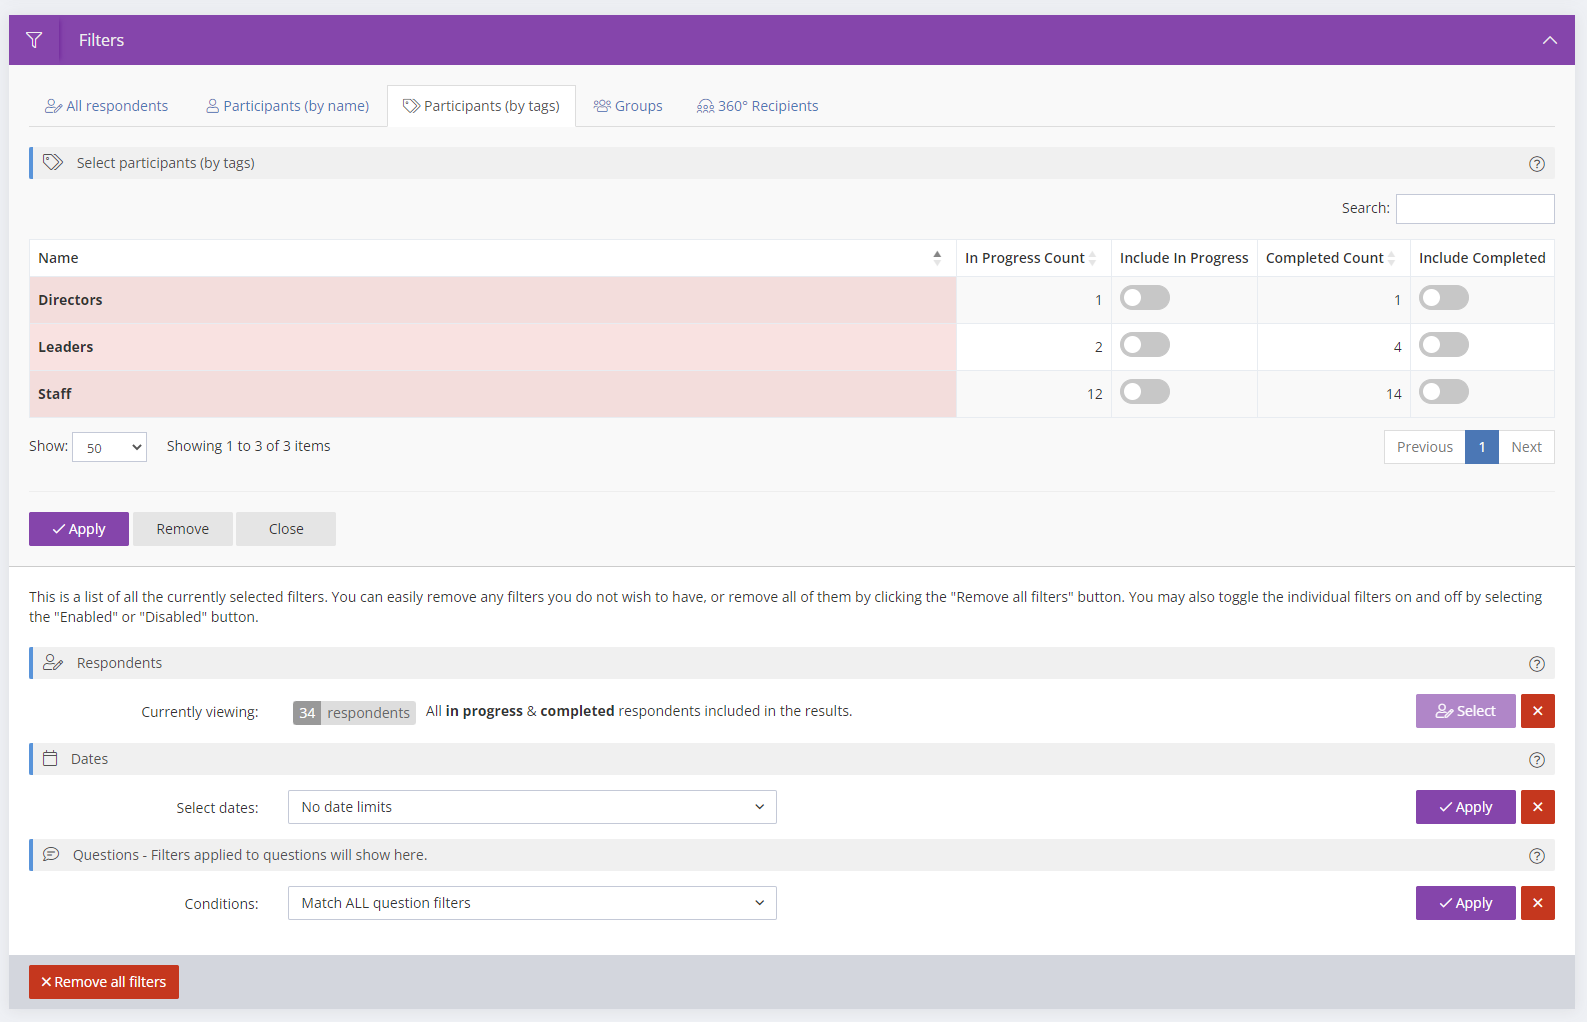
You've always had a lot of control over report filters, but with this release there is a new selection - Participants by tag. Tags are a great way to organise all your content in Spark Chart, but Participant tags are more powerful because you can tap into them via Survey Logic.
For example, based on a participant's response to a question (or more than one), they can automatically be assigned a specific tag. This helps you find them easier in the main Participants list, but now with the new report filter, you can build reports containing people in specific tags. Any survey respondents that have the selected tag added will automatically be included in the report.
Enhanced report viewer filters
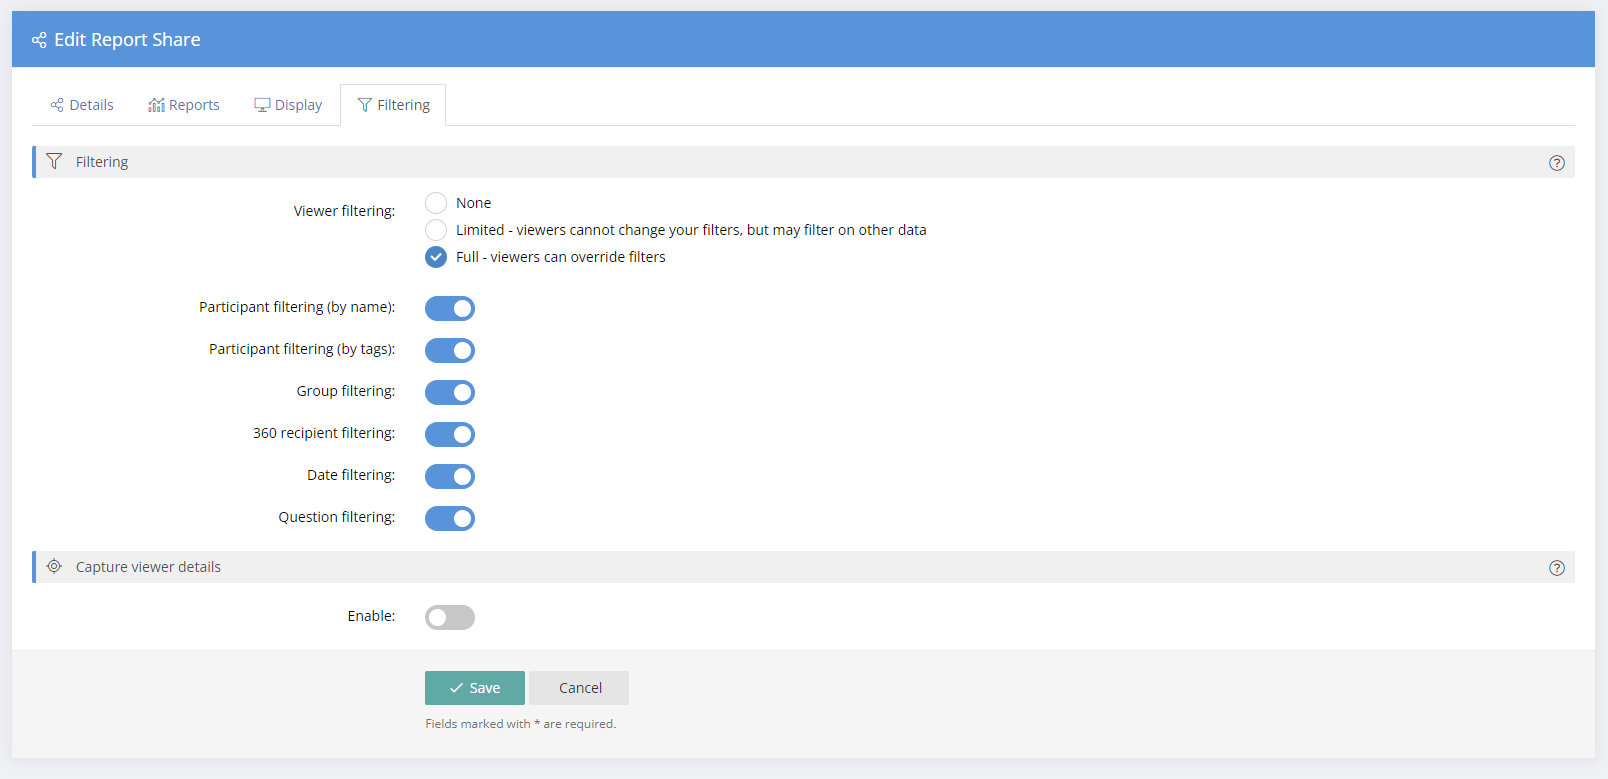
Report viewer filters (that is, filters that can be set by those who have links to Report Shares) now have the ability to filter by participant name and the new participant by tag feature. In addition, selecting participants, groups & 360 respondents in the viewer is much simpler now, with searching & sorting features.
You have full control over what the viewer can filter by, with new filter options in the Report Shares screen.
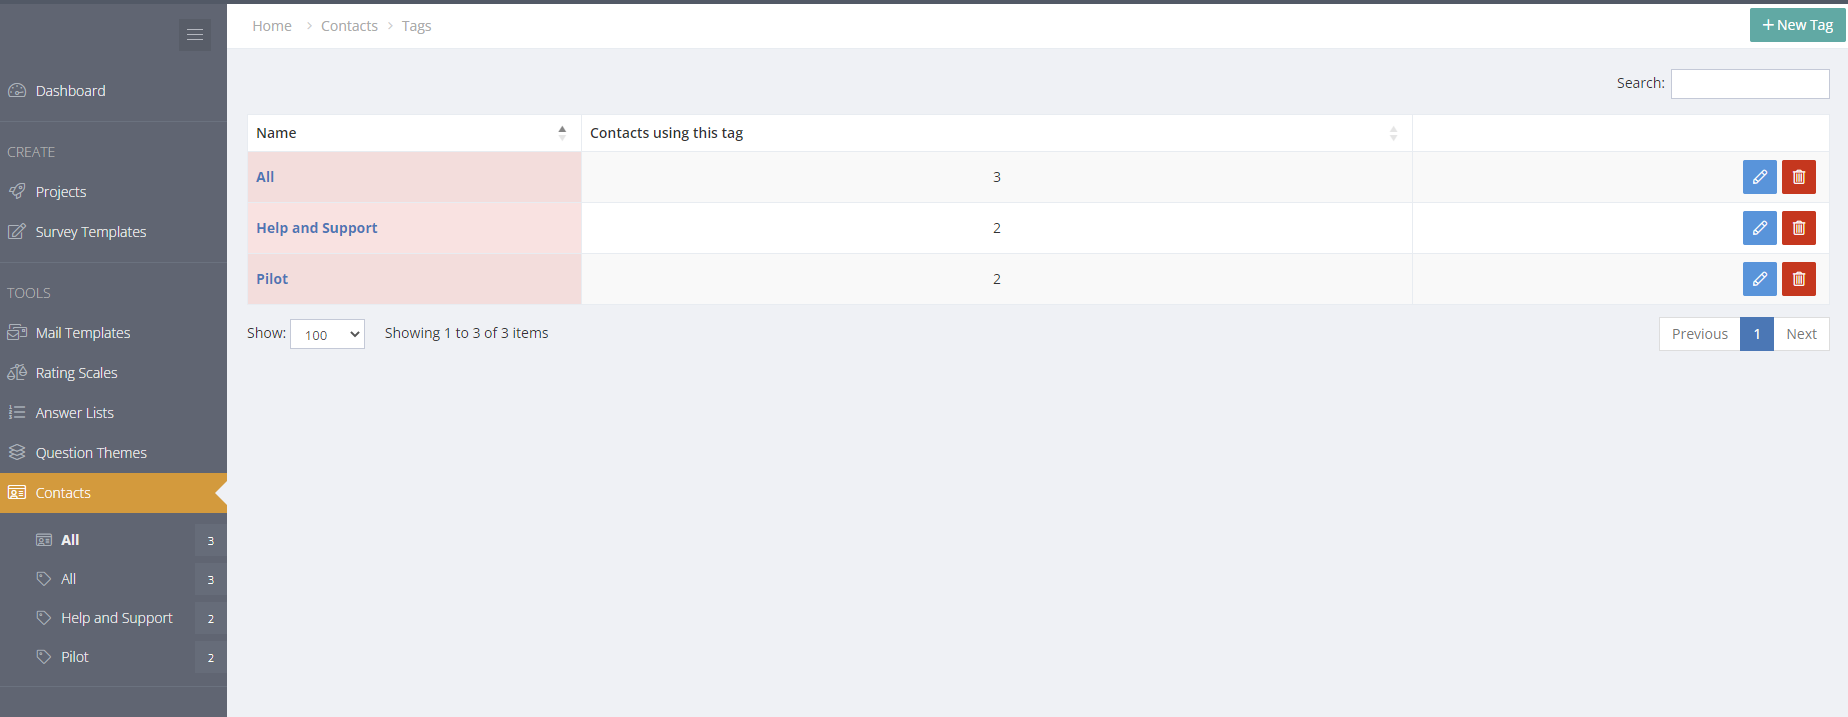
Removed Participant List feature
Participant Lists existed long before tags, and once tags were added to the system, they just duplicated the new functionality. This feature has now been removed, and your old Participant Lists (if you had any) have been converted to Contact tags.