By default a first report is automatically created when launching a project. You can create as many reports as you like. Reports are generated instantly and can be customised, filtered and analyzed. Reports can also be copied with a simple click.
The Report Shares feature provides an easy way to share survey results. Simply select the Report Shares menu, create a new Report Share, select the reports to include and save. Shared reports may be open to the public or they may be protected with a password or a numeric PIN code.
Click here to see a sample shared report.
In this article
Free text question options (including Word Cloud)
Question settings (hide or show elements)
Print reports or export results (including creating PDF and Microsoft Word versions)
Net Promoter Score - automatic calculation and guage
The Reports Window
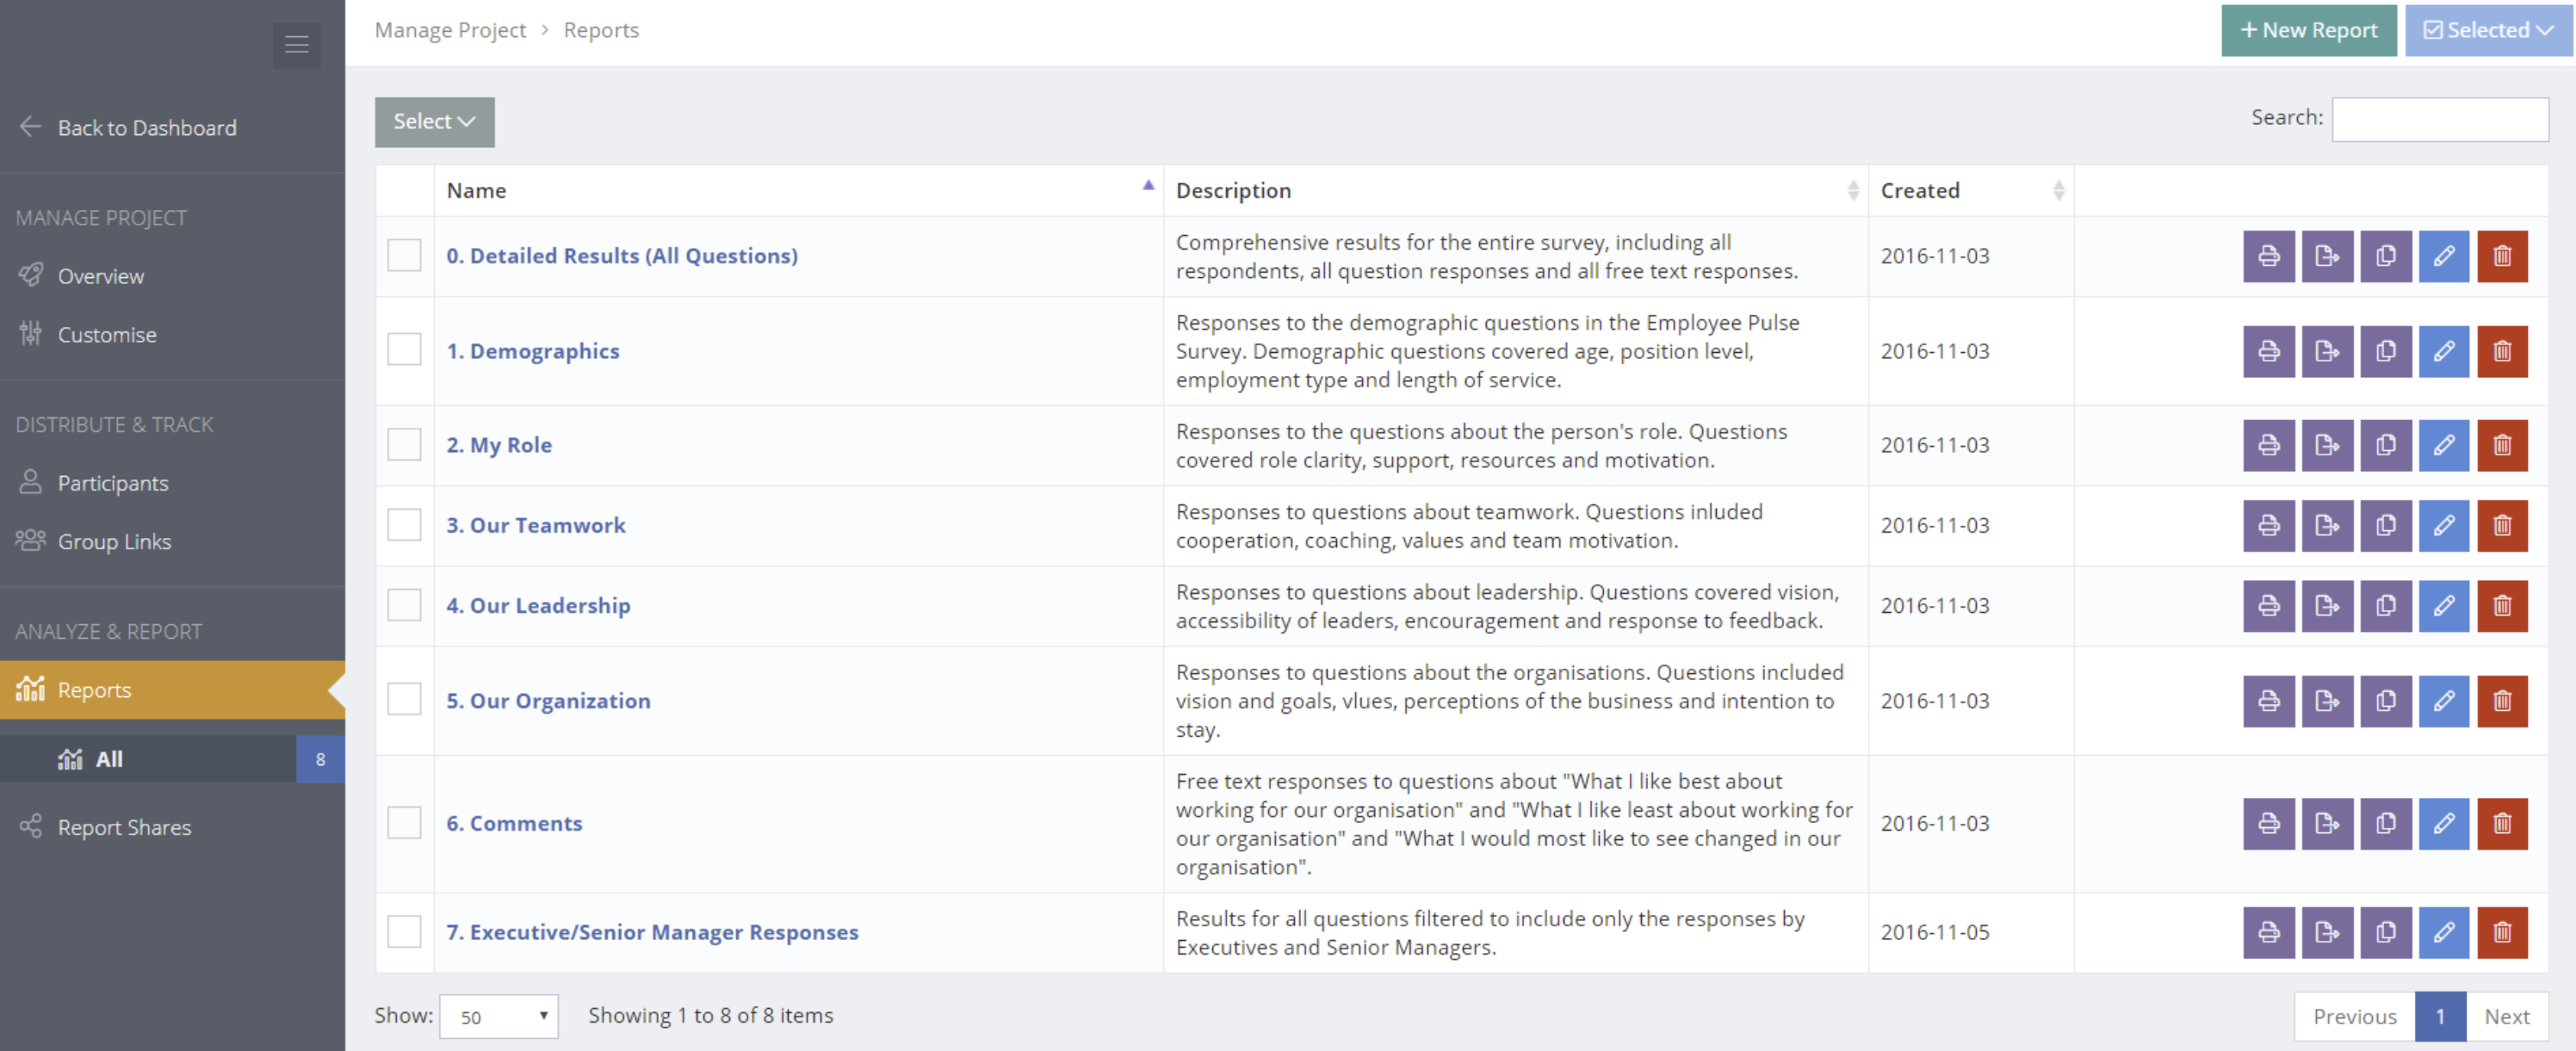
Add, Edit and Copy a Report
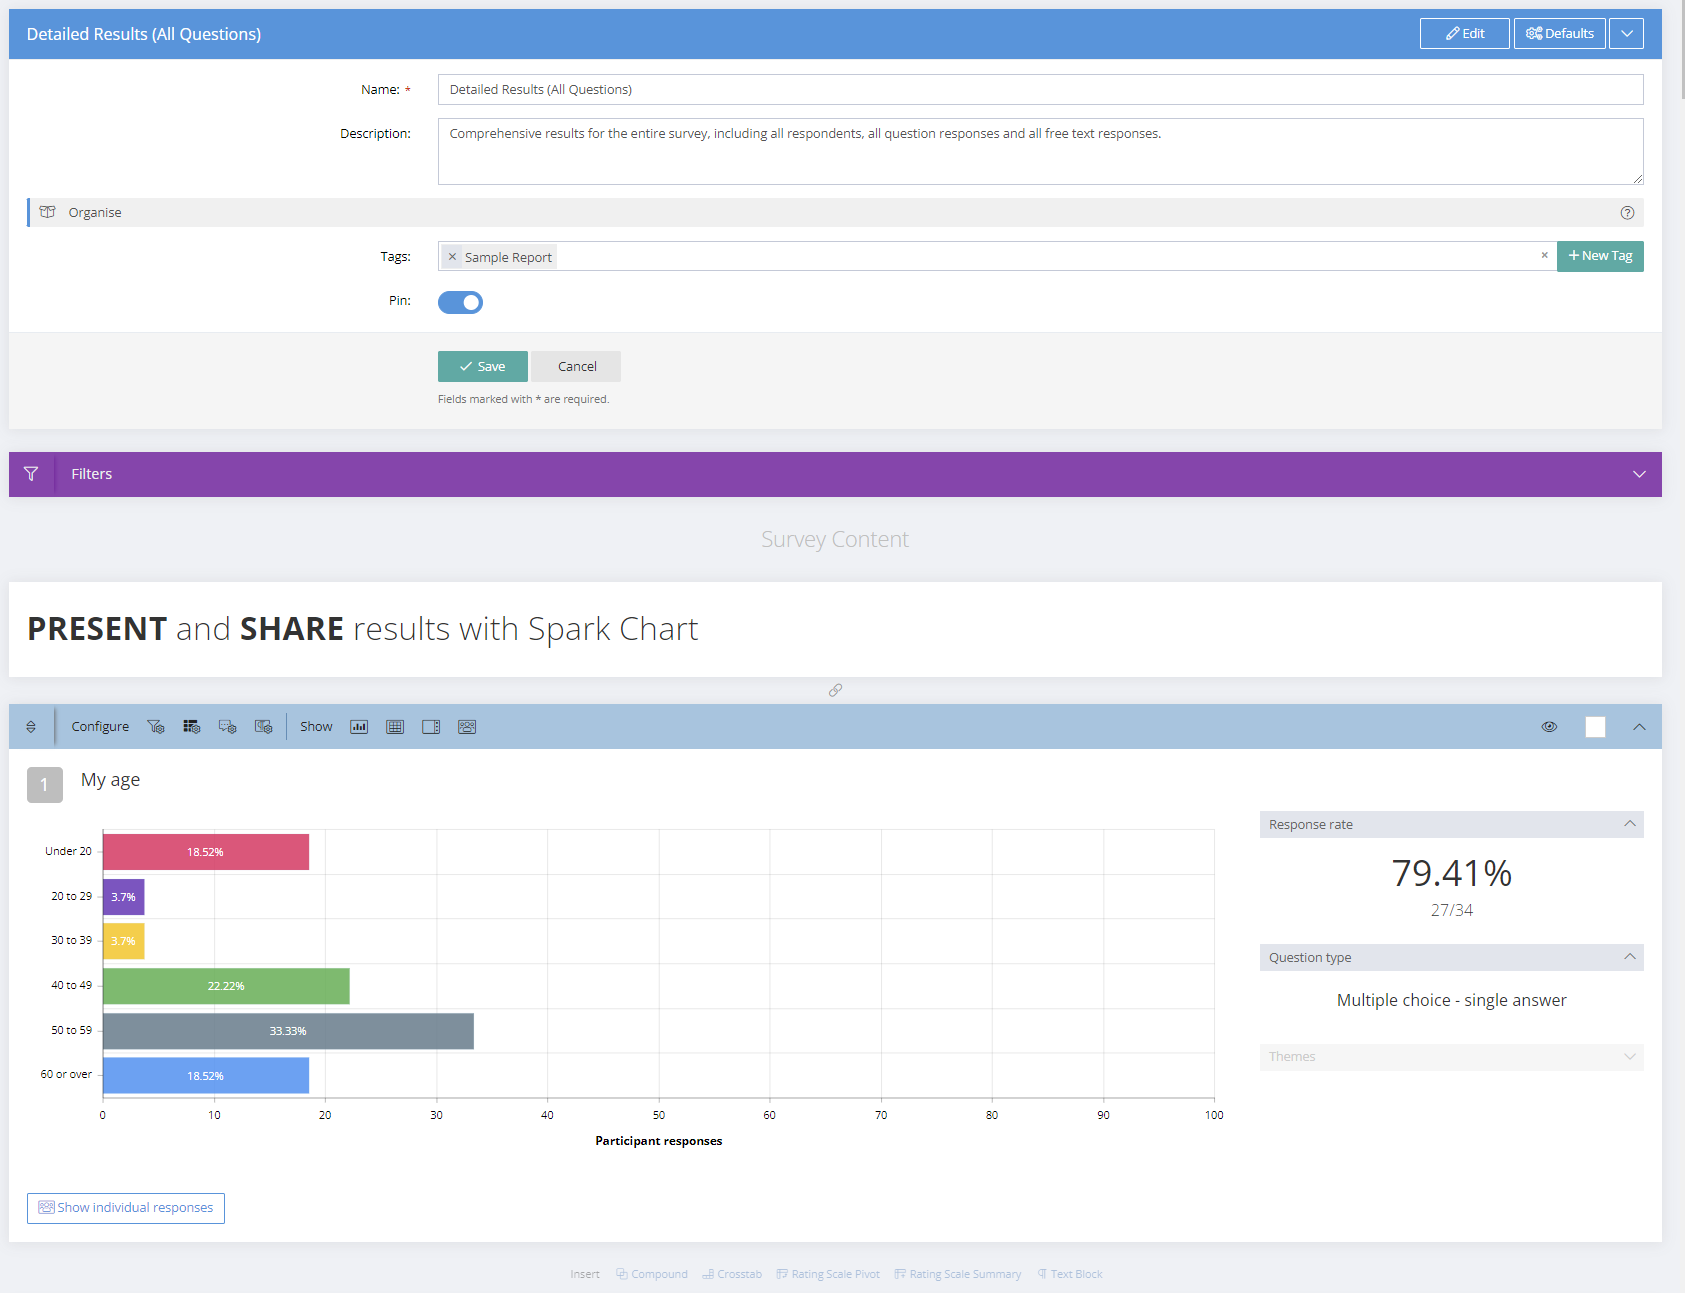
To create a report, go to the Reports menu and select the + New Report button in the top menu. Edit the report name and description and then click Save. After creating the report, the layout of results can be customised and the results can be filtered.
Reports can be easily copied and then edited. Click the copy button alongside, edit the name and save. All customising and filtering will be copied. Note: if you copy a report that has been shared the copy will not be visible until shared.
Reports can be archived or deleted permanently. To archive a report, select the "Archive" button alongside the report and confirm. Archived reports will appear in an "Archived" menu under the Reports menu. From the Archive menu, reports can be restored or permanently deleted.
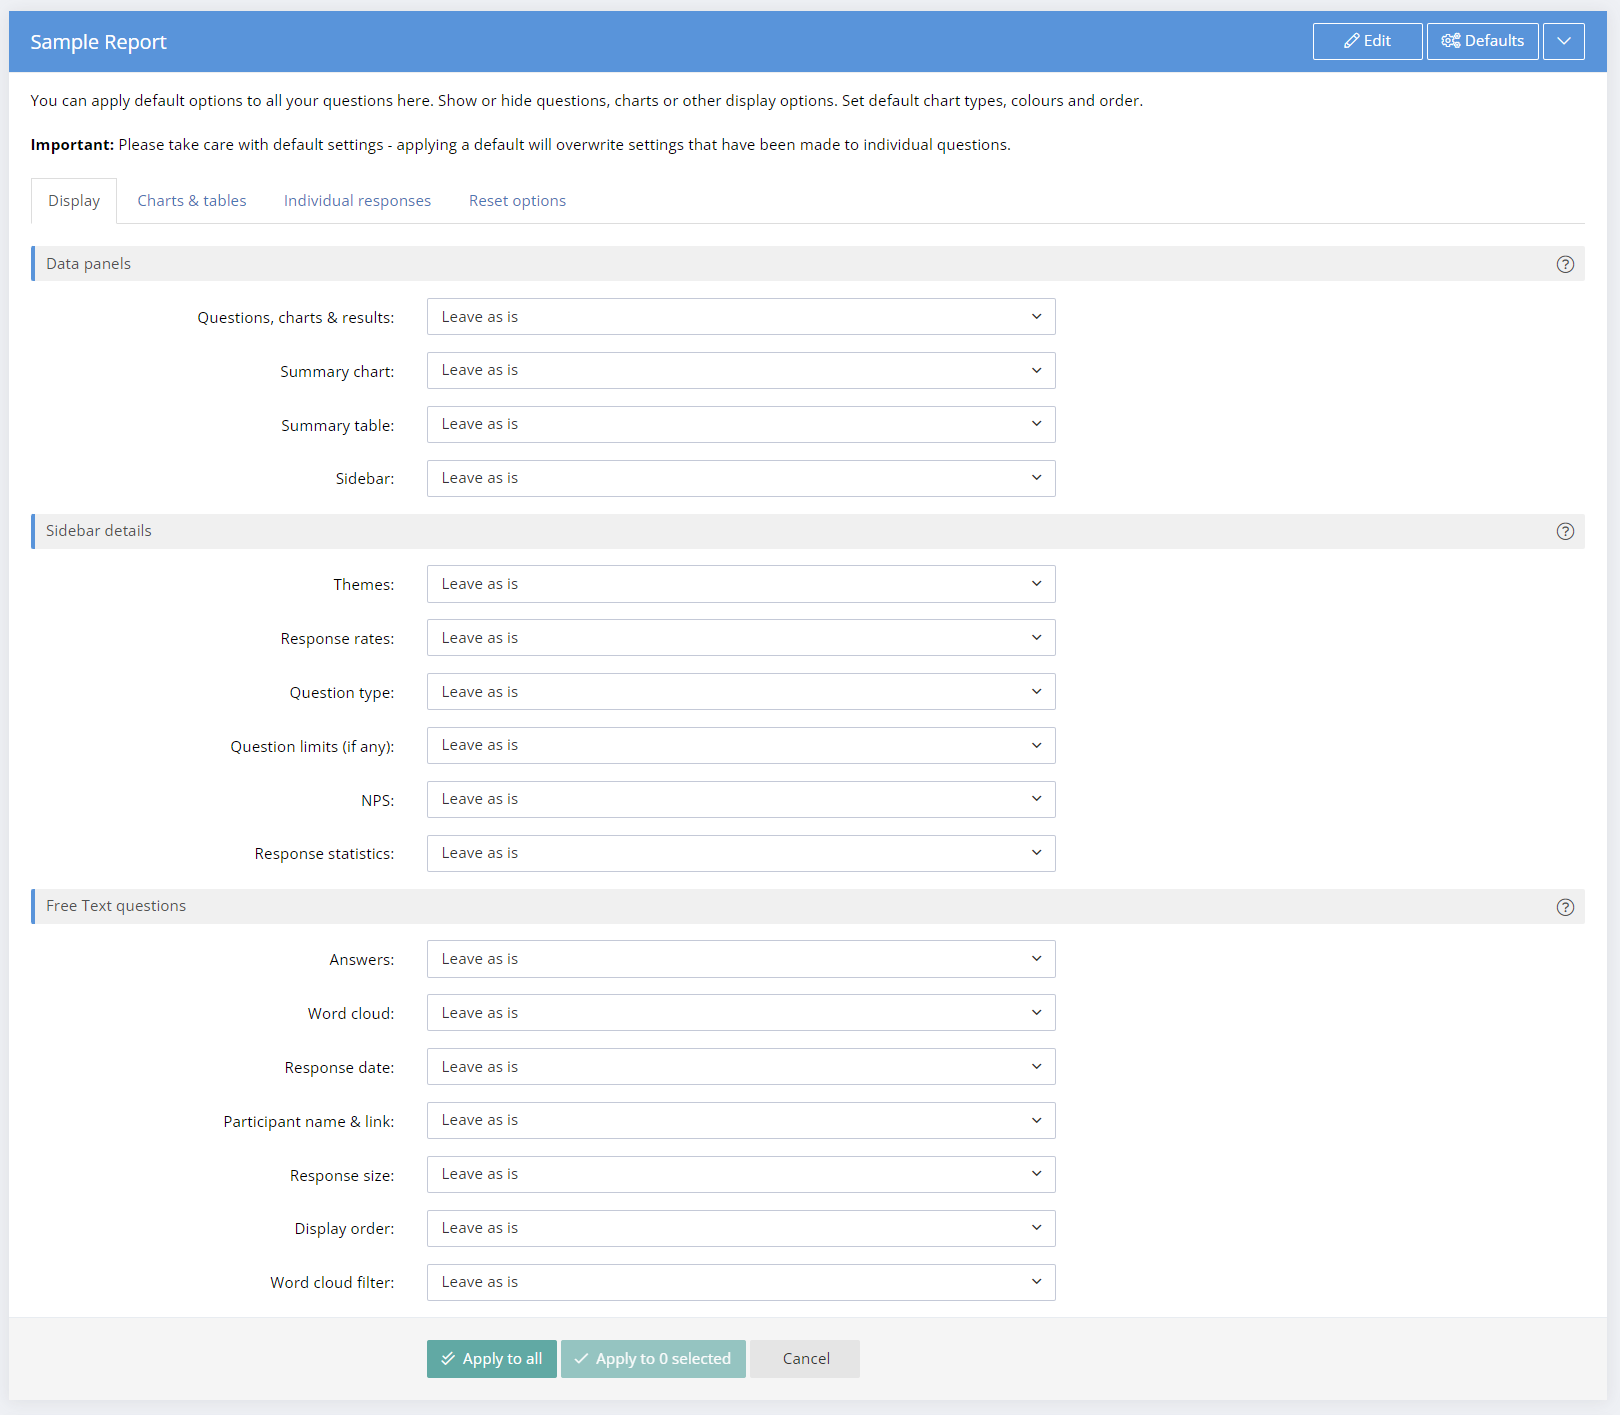
Setting Defaults
Defaults can be set from the Defaults button in the blue bar at the top of the report. There are various tabs, with settings for Display, Chart & Tables, Individual Responses, along with Reset options. Defaults can be set for all questions or for selected questions. There is a select option in the panel for each individual questions.
Individual Question Layouts & Options
Individual question results have a menu above with icons that vary depending on the question type.
There are icons to Configure Filters, Layout options, Chart and Tables options, Individual Response options, and Attach Rich Text to the question results.
There are also icons to Show or Hide individual elements when sharing reports, including a data table, response statistics, response rate, respondent comments, additional response text and a list of individual responses.
Whole questions can be hidden by clicking the eye icon at the top right and the menu bar will turn grey. All results and elements for the question will then be hidden when sharing. On broswer refresh, the whole question element will be collapsed by default until the eye icon is clicked again to show.
There is a tck box selector for each question to allow defaults to be applied to selected questions. Select the desired questions and then go to the Defaults tab at the top of the page, make default selections and "Apply to selected".
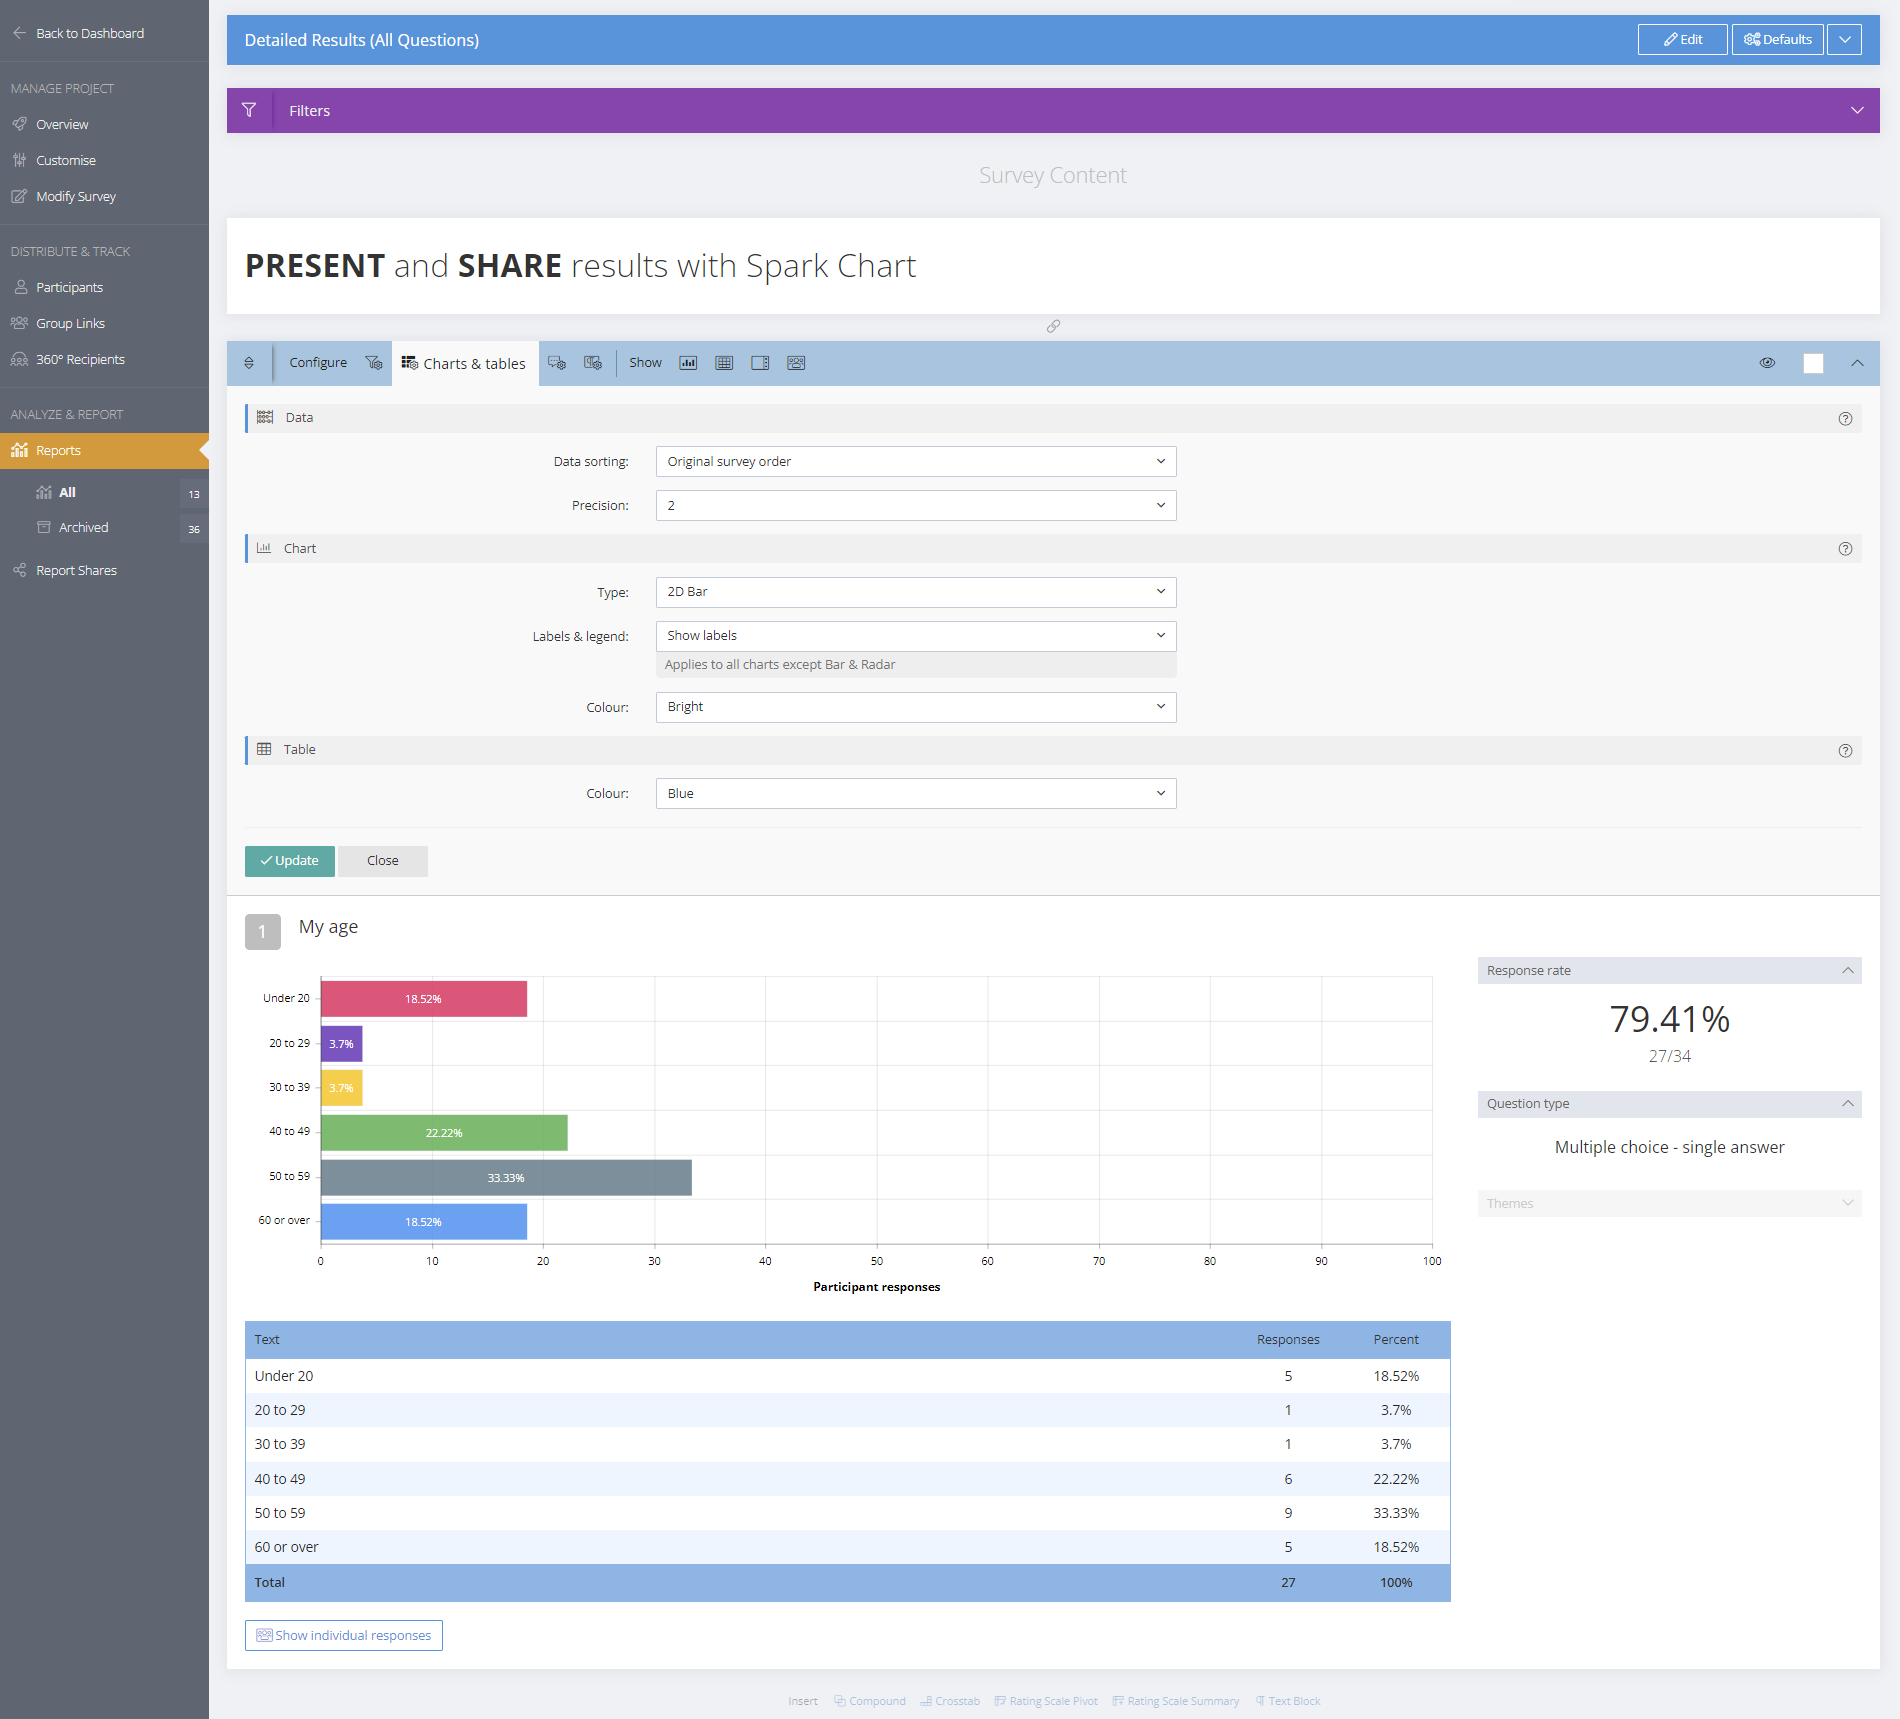
Chart & Table Options
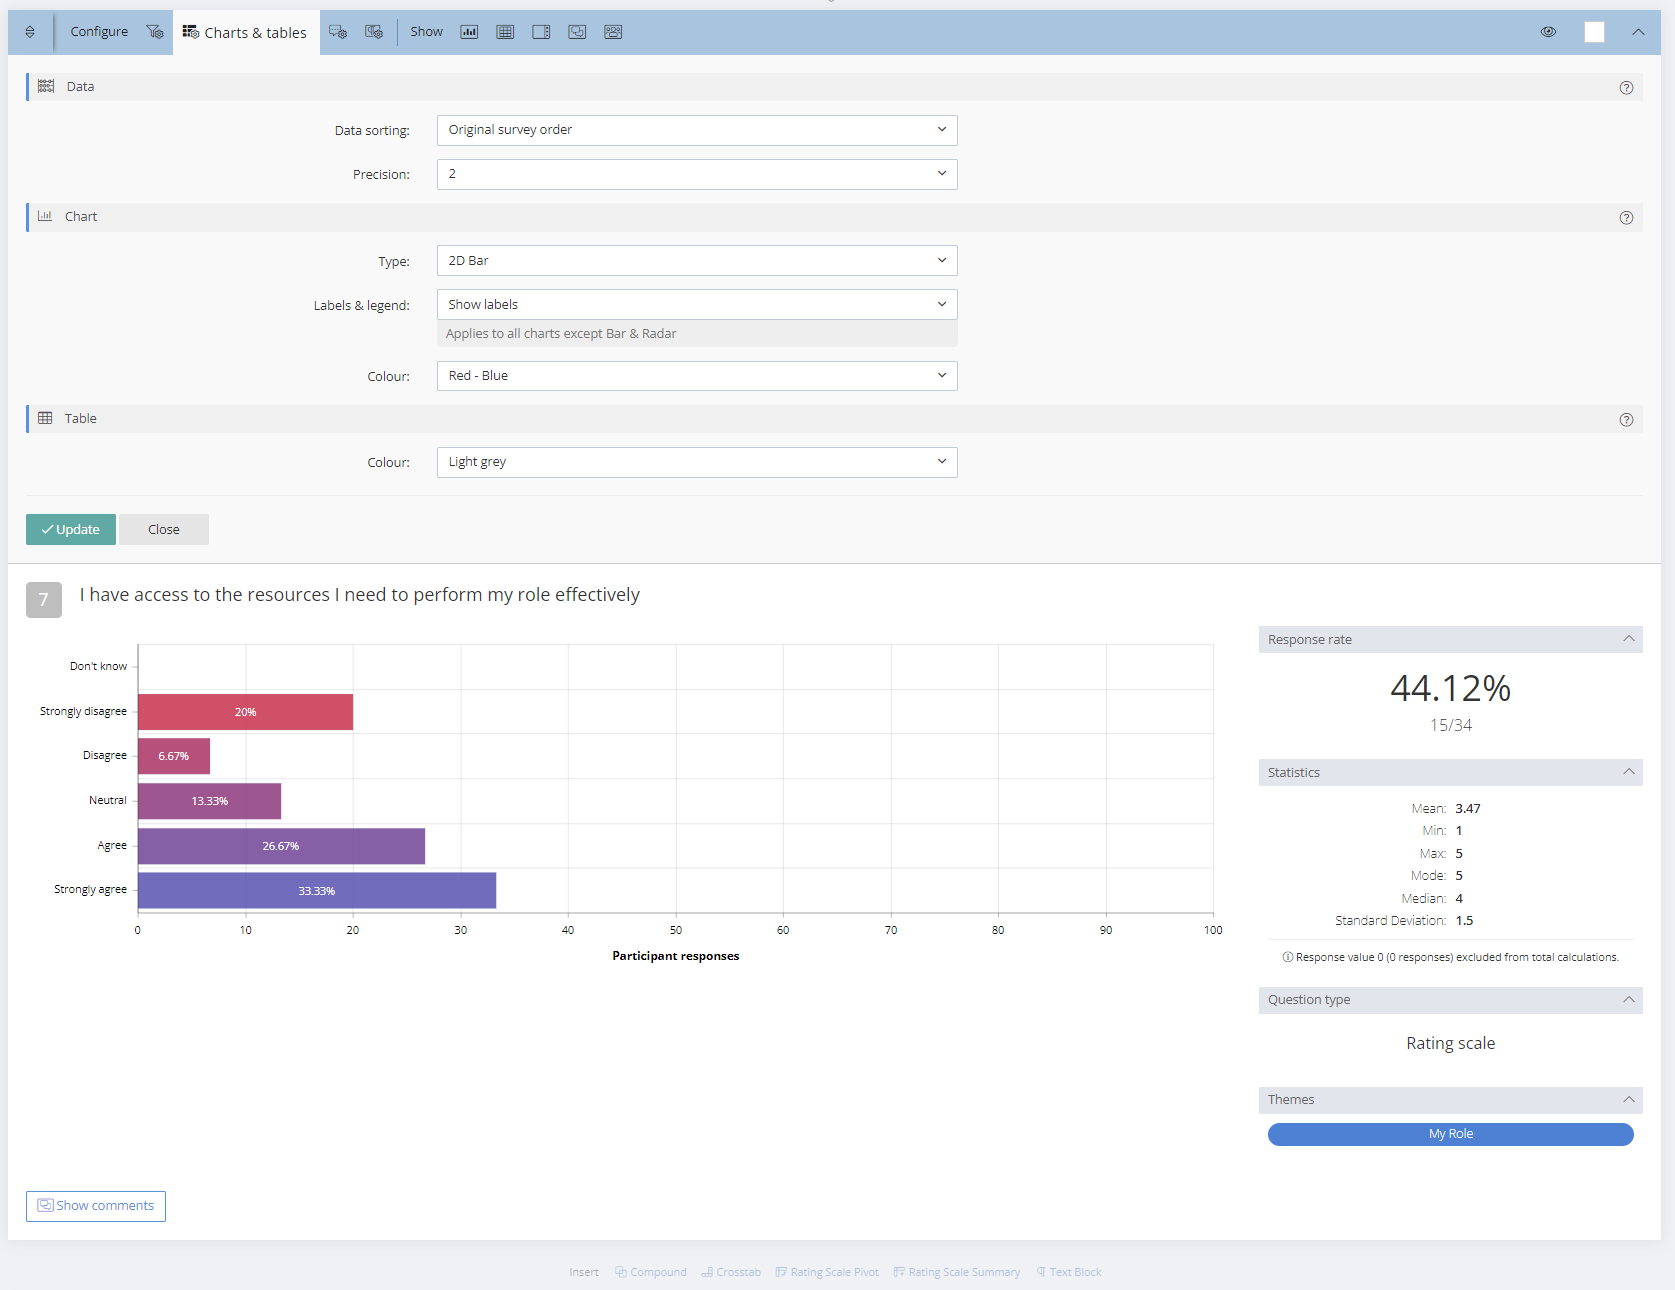
Chart Types and colours, table colours and data sorting/precision options can be selected from the Chart & Tables icon.
Free Text Questions (Including Word Cloud)
Responses to Free Text questions can be toggled between shown or hidden using the Show Toggle answers icon. There are options from the Configure/Display icon to show the comment date, participant name and a link to the individual participant's responses. The comment display size can be adjusted and the comments can be sorted from newest to oldest and vice versa. By default, comments are shown newest to oldest in full length with the date. Names and links to results are hidden by default. A Word Cloud can be enabled here and unwanted words can be filtered out.

Additional Comments Attached to Questions
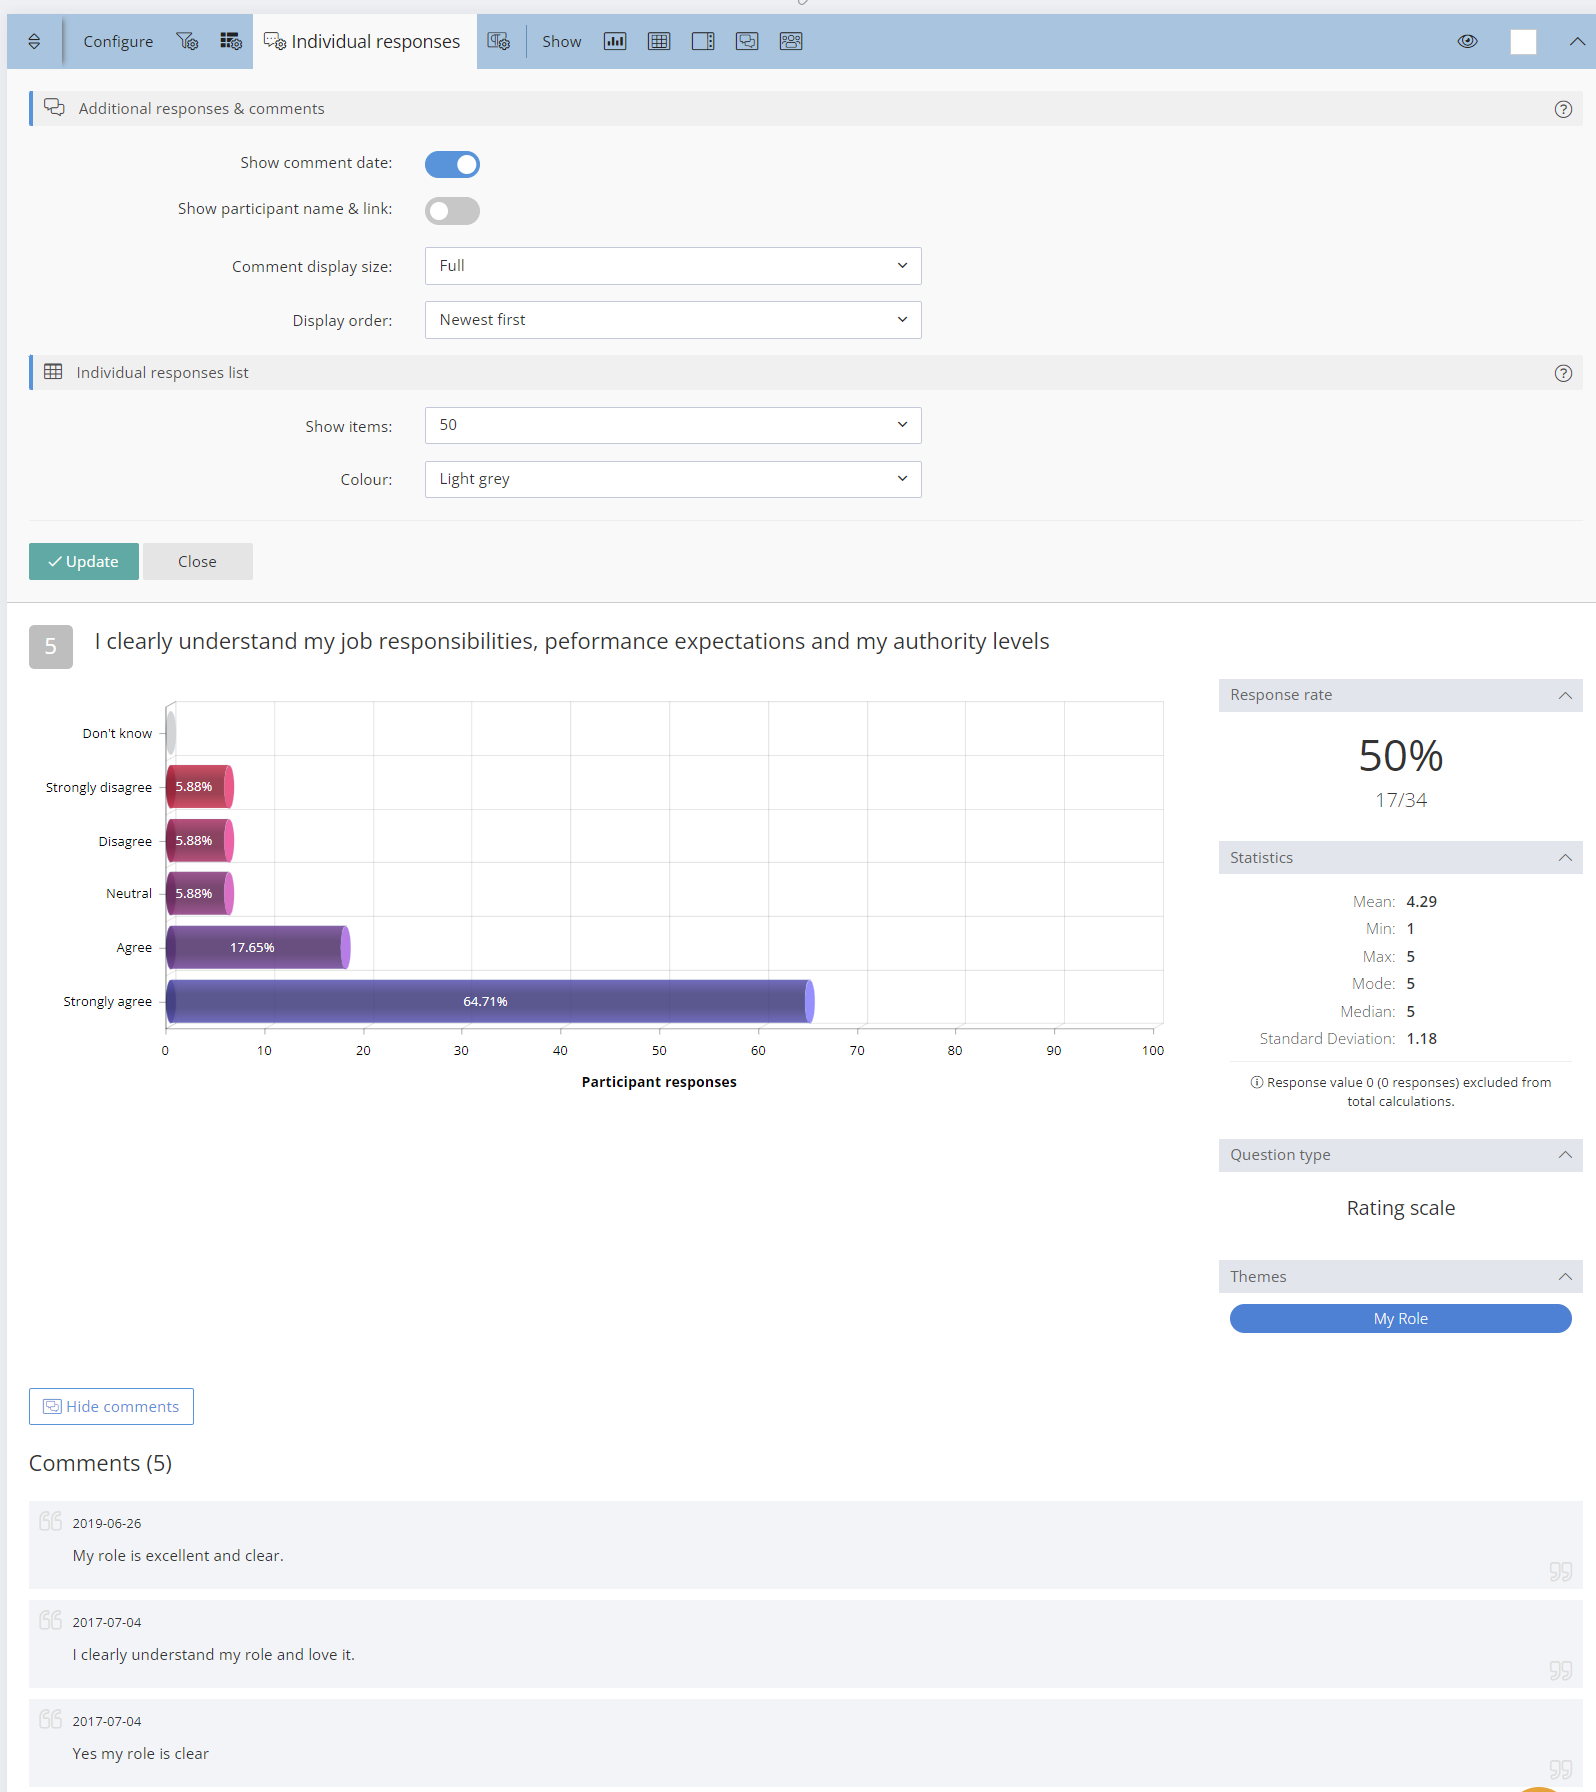
Additional comments attached to individual data type questions can be toggled between shown or hidden using the Show Toggle comments icon Click the "Show comments" button when toggled on to show the individual comments.There are options from the Configure "Individual responses" icon to show the comment date, participant name and link, adjust the comment display size and set the display order.
Individual Responses List
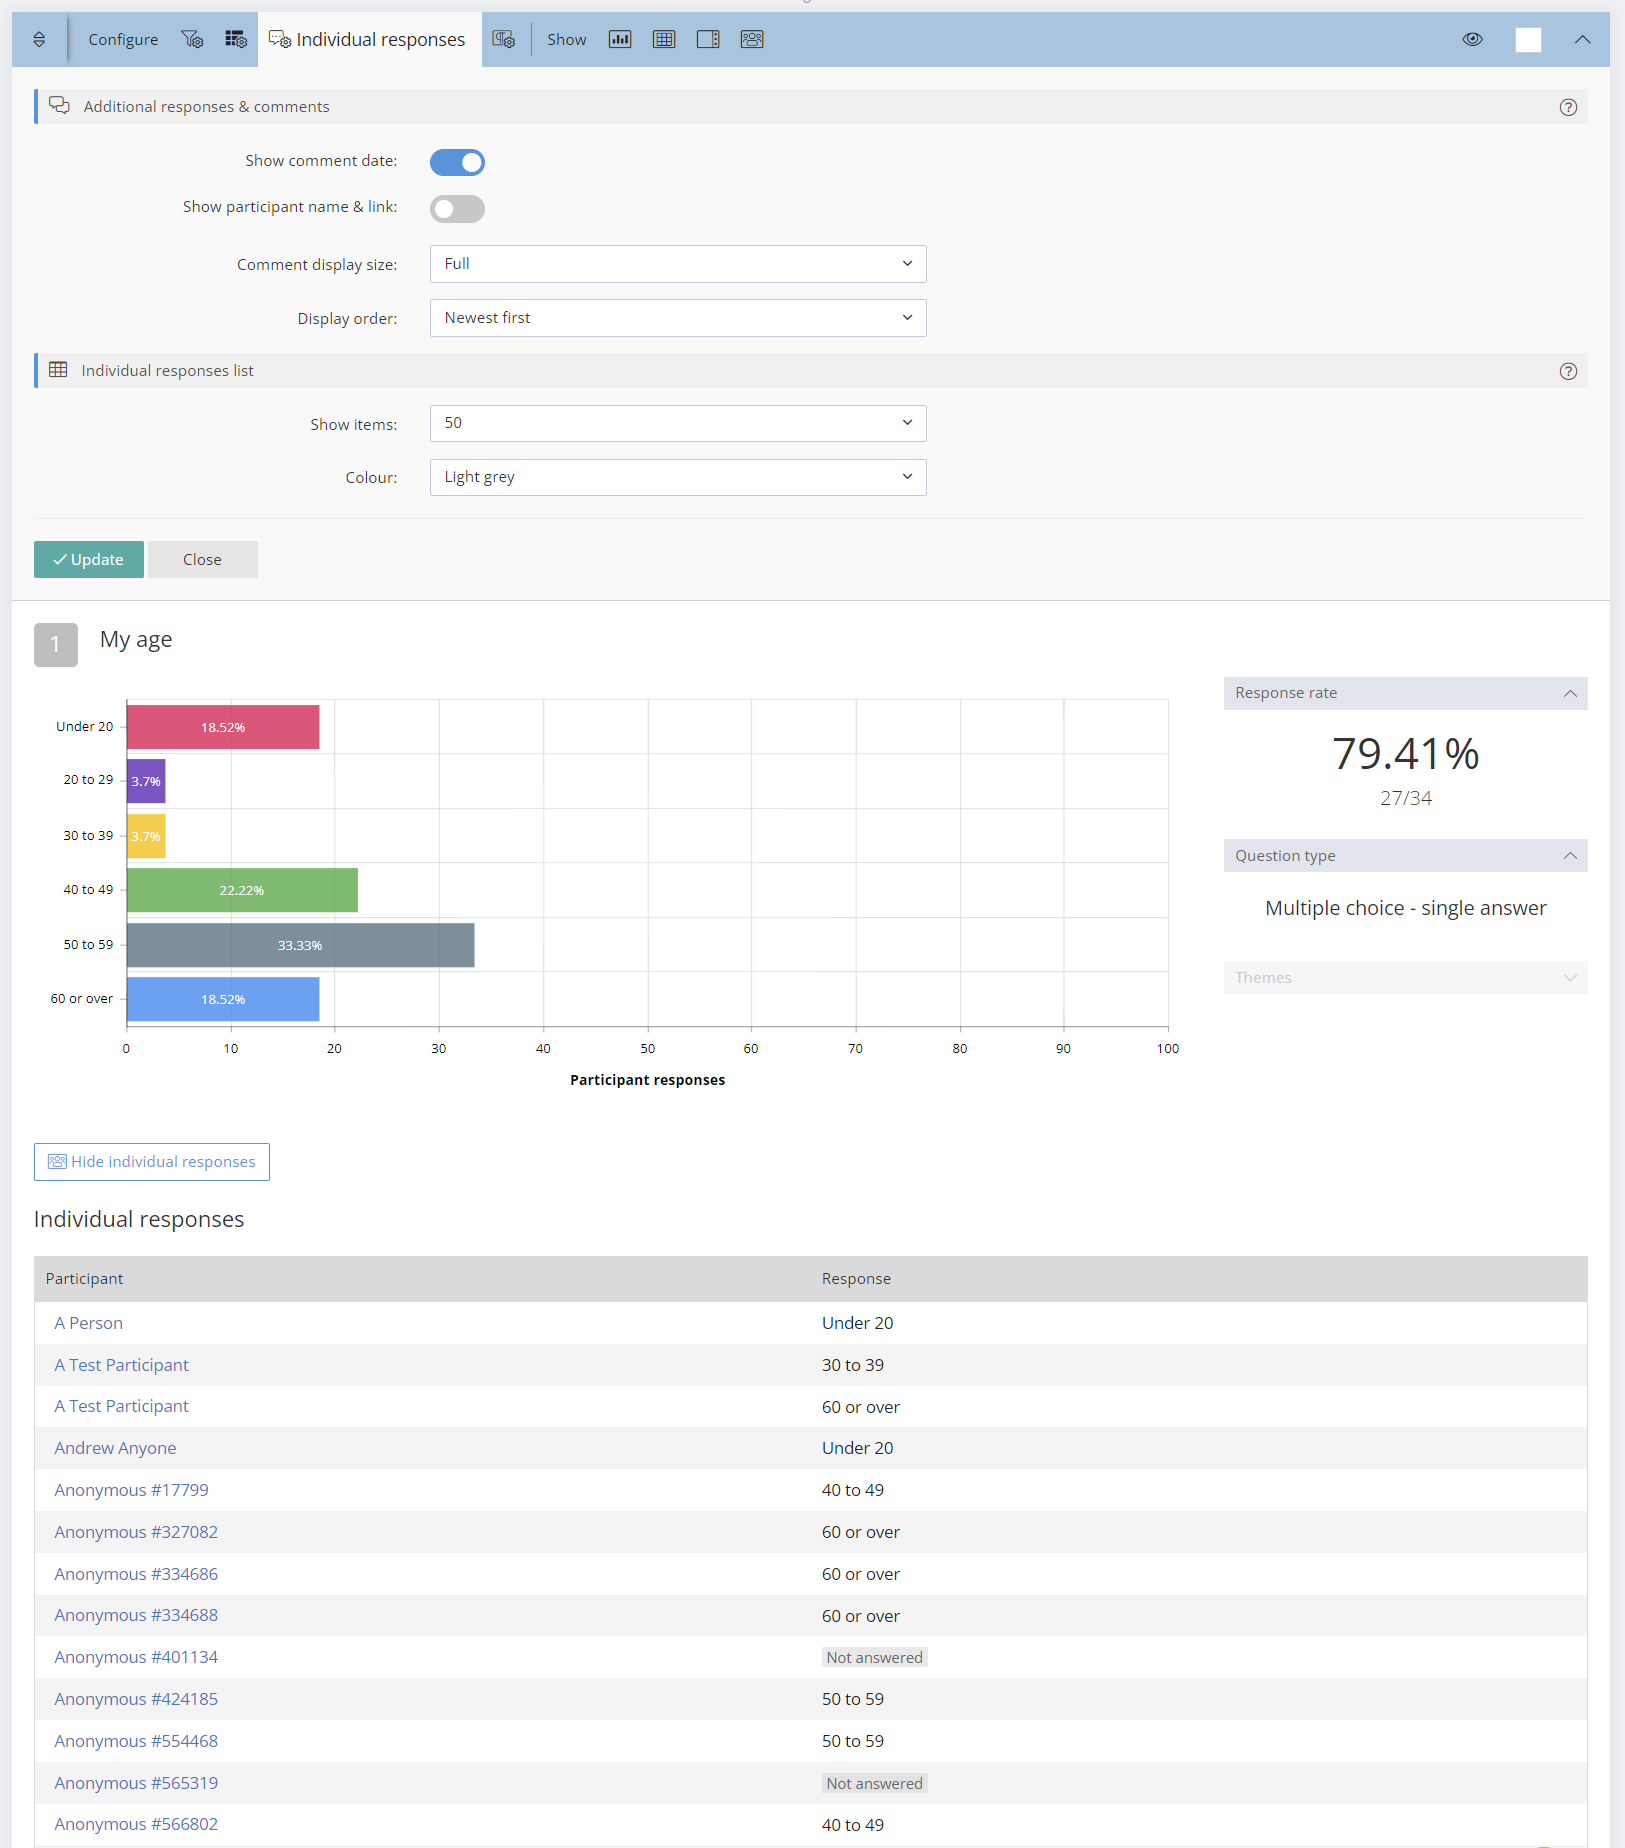
A list of individual responses can be enabled from the "Show individual response list" icon and options can be confidured from the "Configure Individual responses" icon. The first time individual responses are enabled for a single question, a browser refresh will be requested before the responses list shows. Individual responses can be enabled from the Defaults menu for all questions or selected questions.
Add Rich Text Blocks
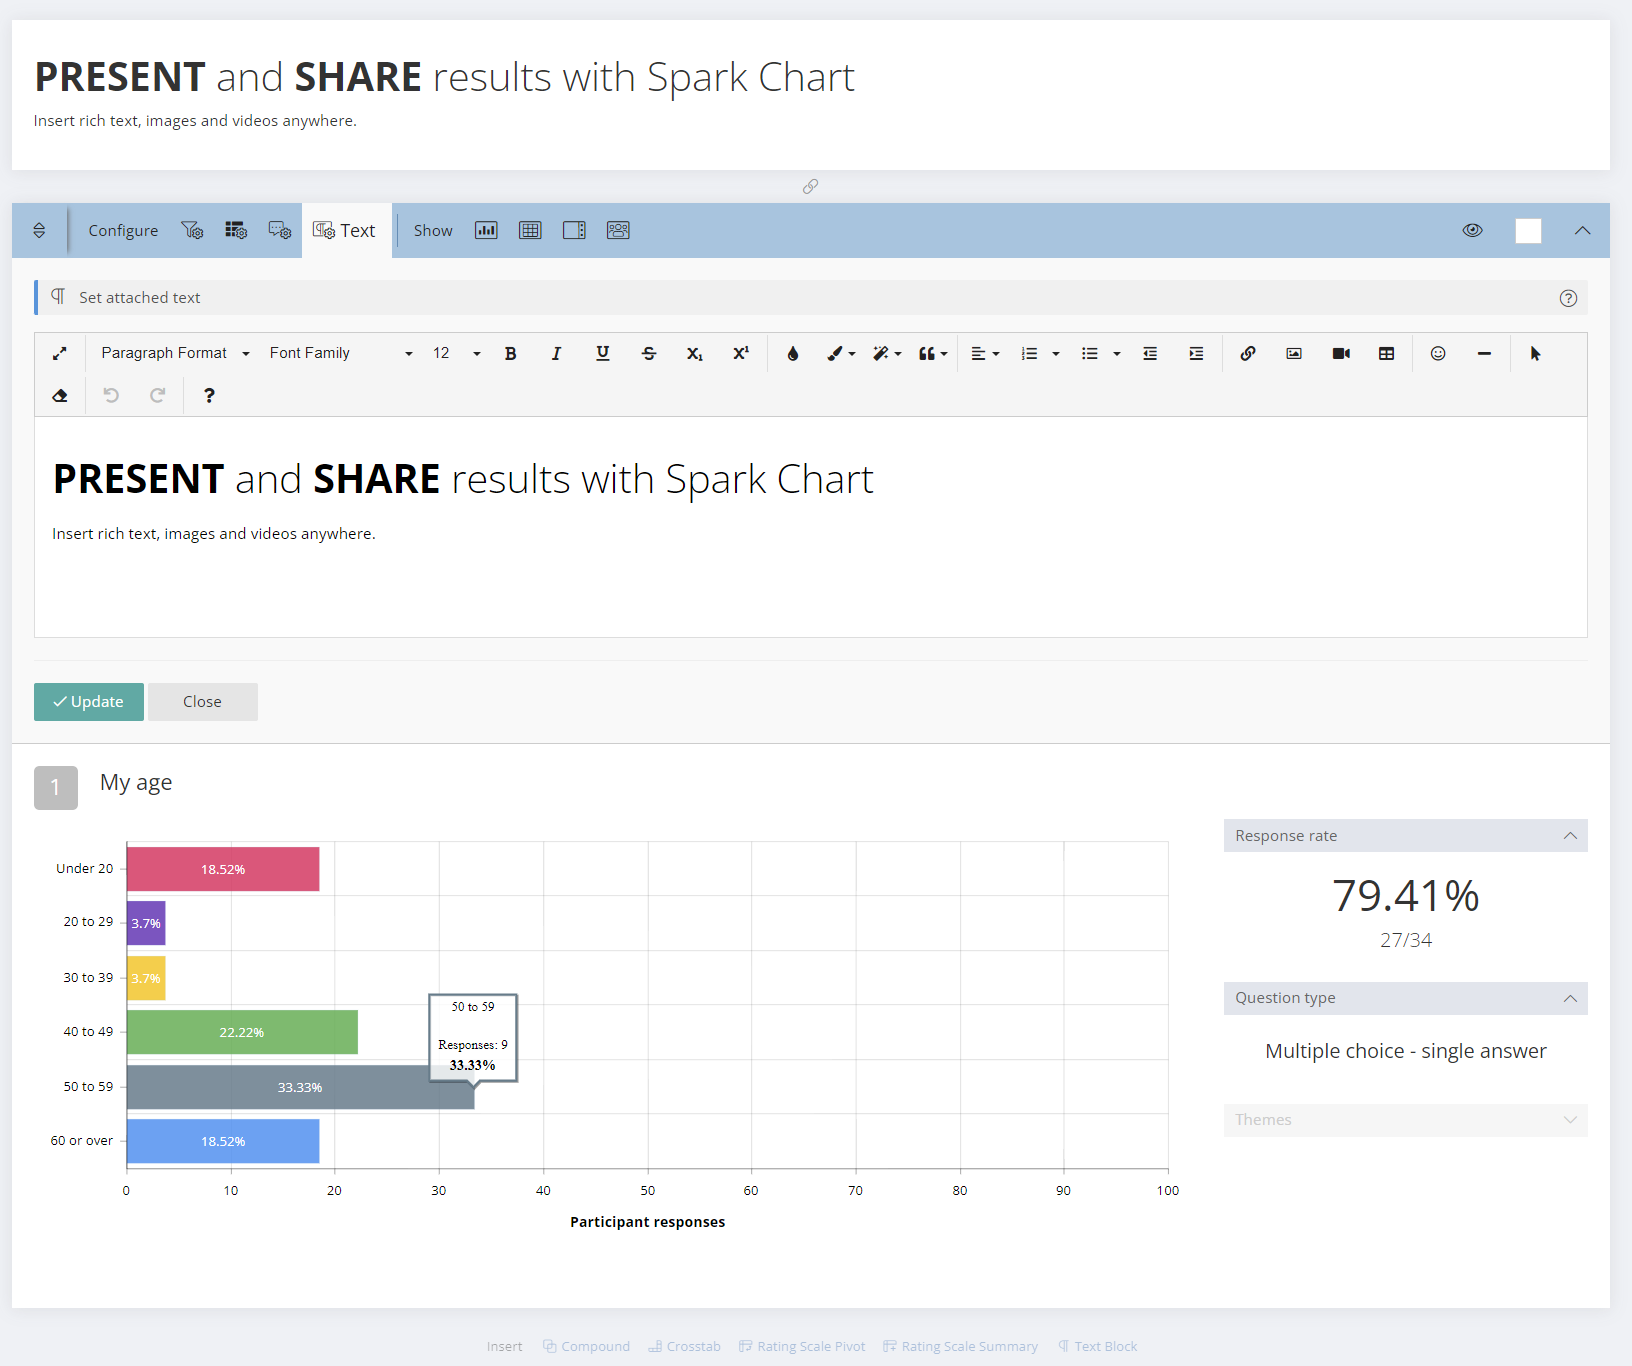
Rich text blocks, including images, videos, tables and more can be attached to individual questions using the Configure attached text icon in the question menus. <>When attached to an individual question, the text will move with the question.
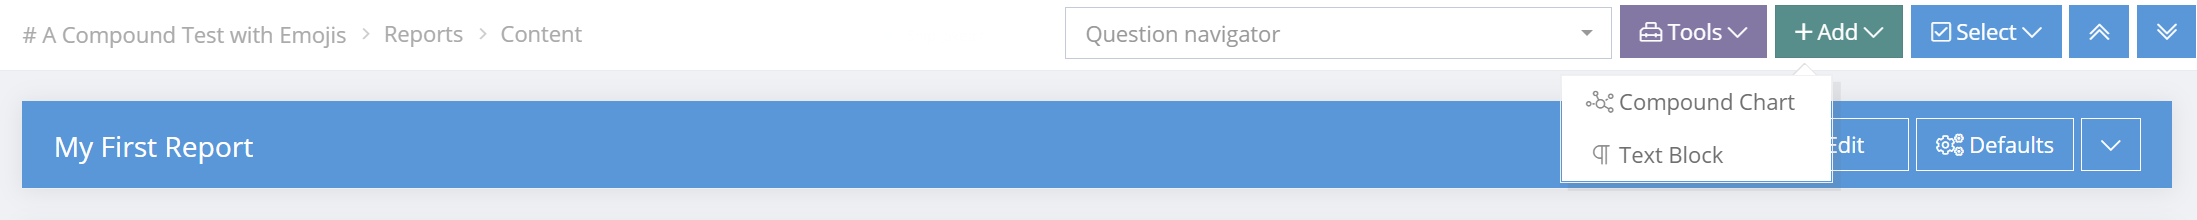
Alternatively, rich text can be inserted using the Insert text Block icon below a question or from the + Add Text Block menu button at the top of the report. The text block can then positioned anywhere in a report using drag and drop.
Question Settings (Hide or Show Elements)
Various settings can be managed from the Configure and Show menus above the chart or question responses.
Choose the "Configure attached text" icon to attach messages and rich text above the responses. The rich text will be visible when the survey results are shared. This attached text will move with the question responses when dragging and dropping.
Choose the "Eye" icon to show or hide individual question when the report is shared. Hidden questions turn to a grey colour.
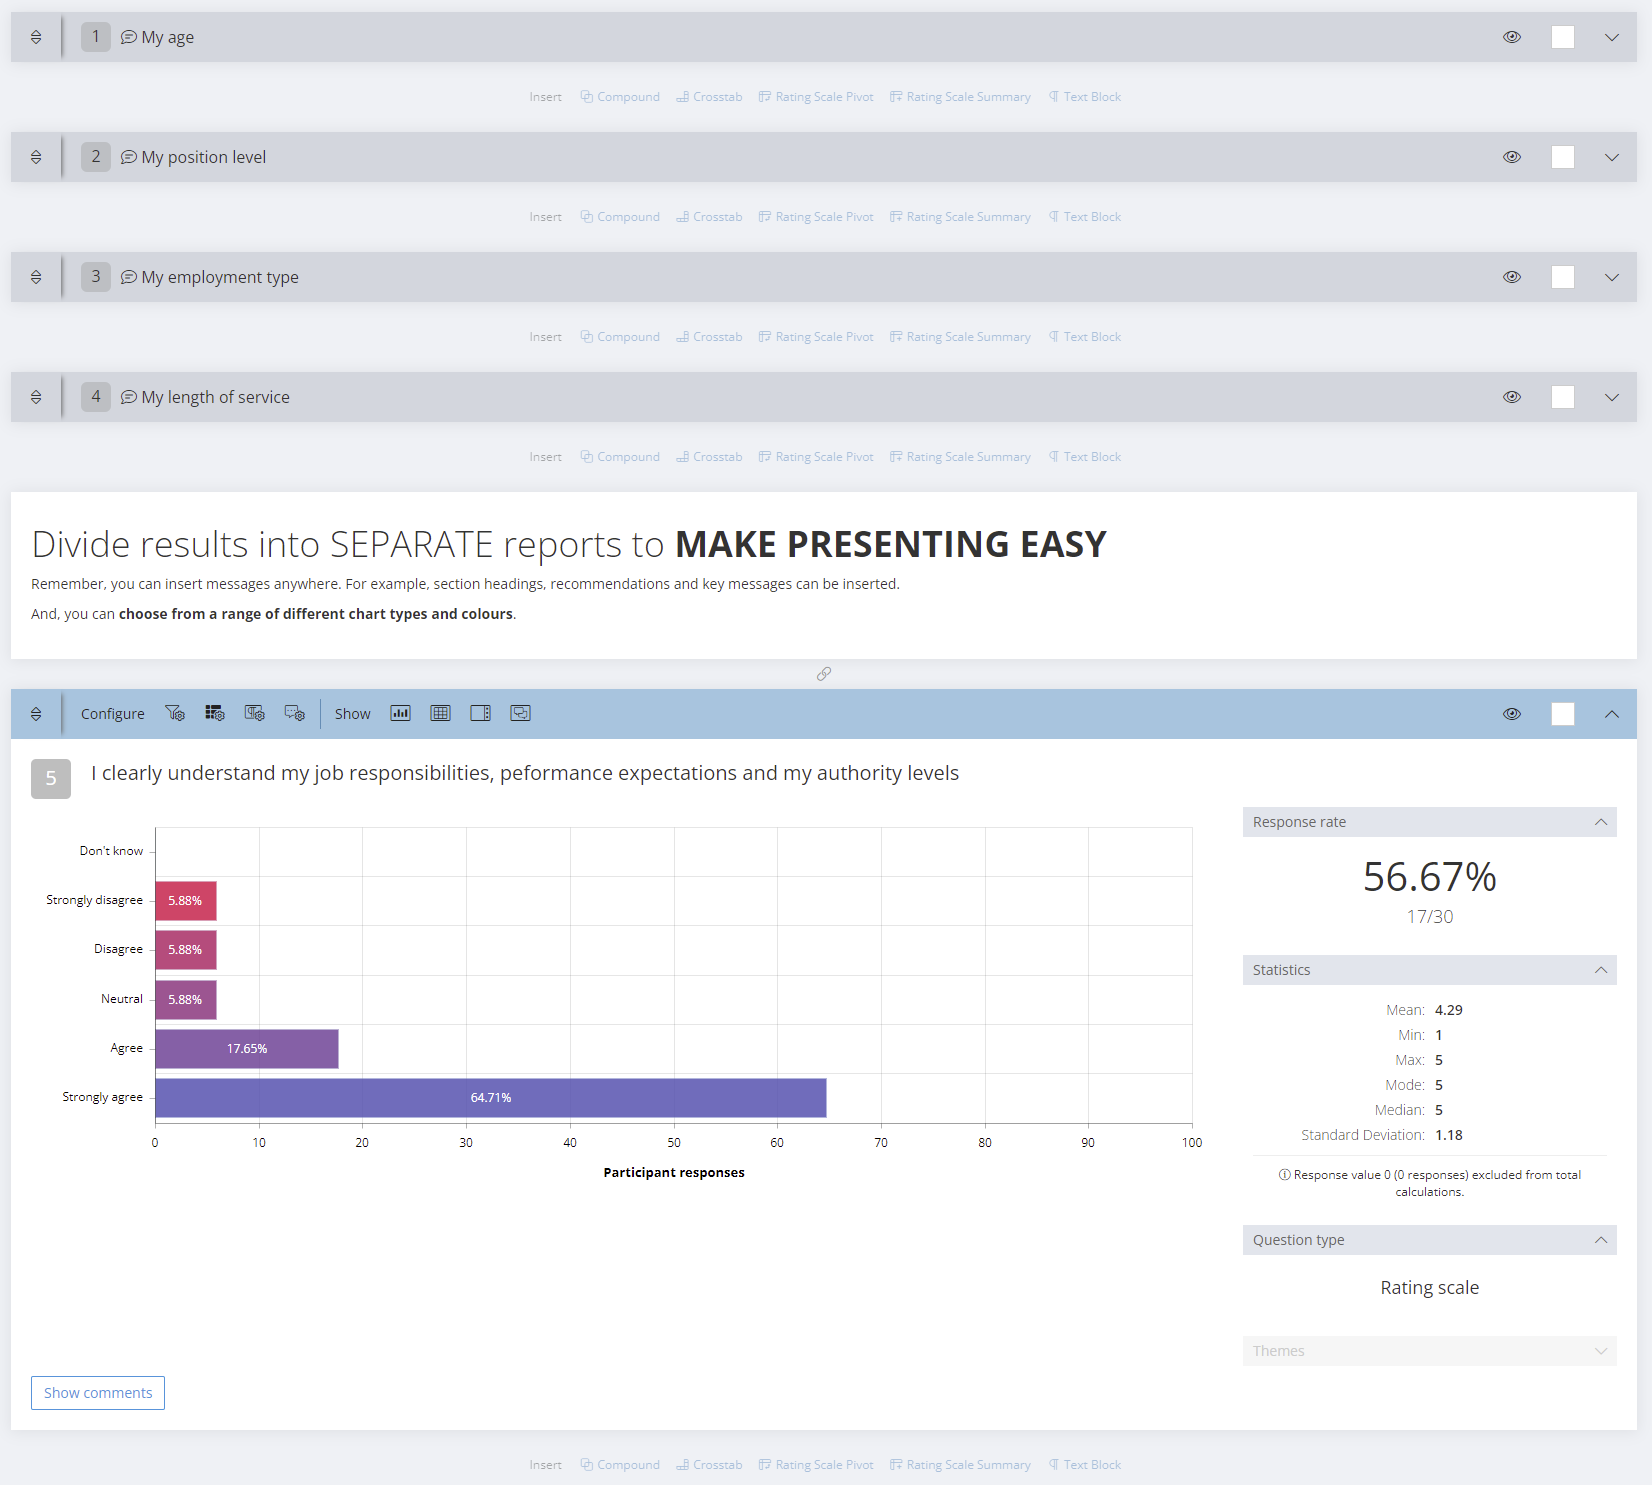
Side panel elements, with response rate, statistics, question type and question theme, can be hidden individually. The whole side panel can also be hidden from the Show menu.
A data table is hidden by default but can be displayed by choosing the Data Table Icon.
Filtering Results
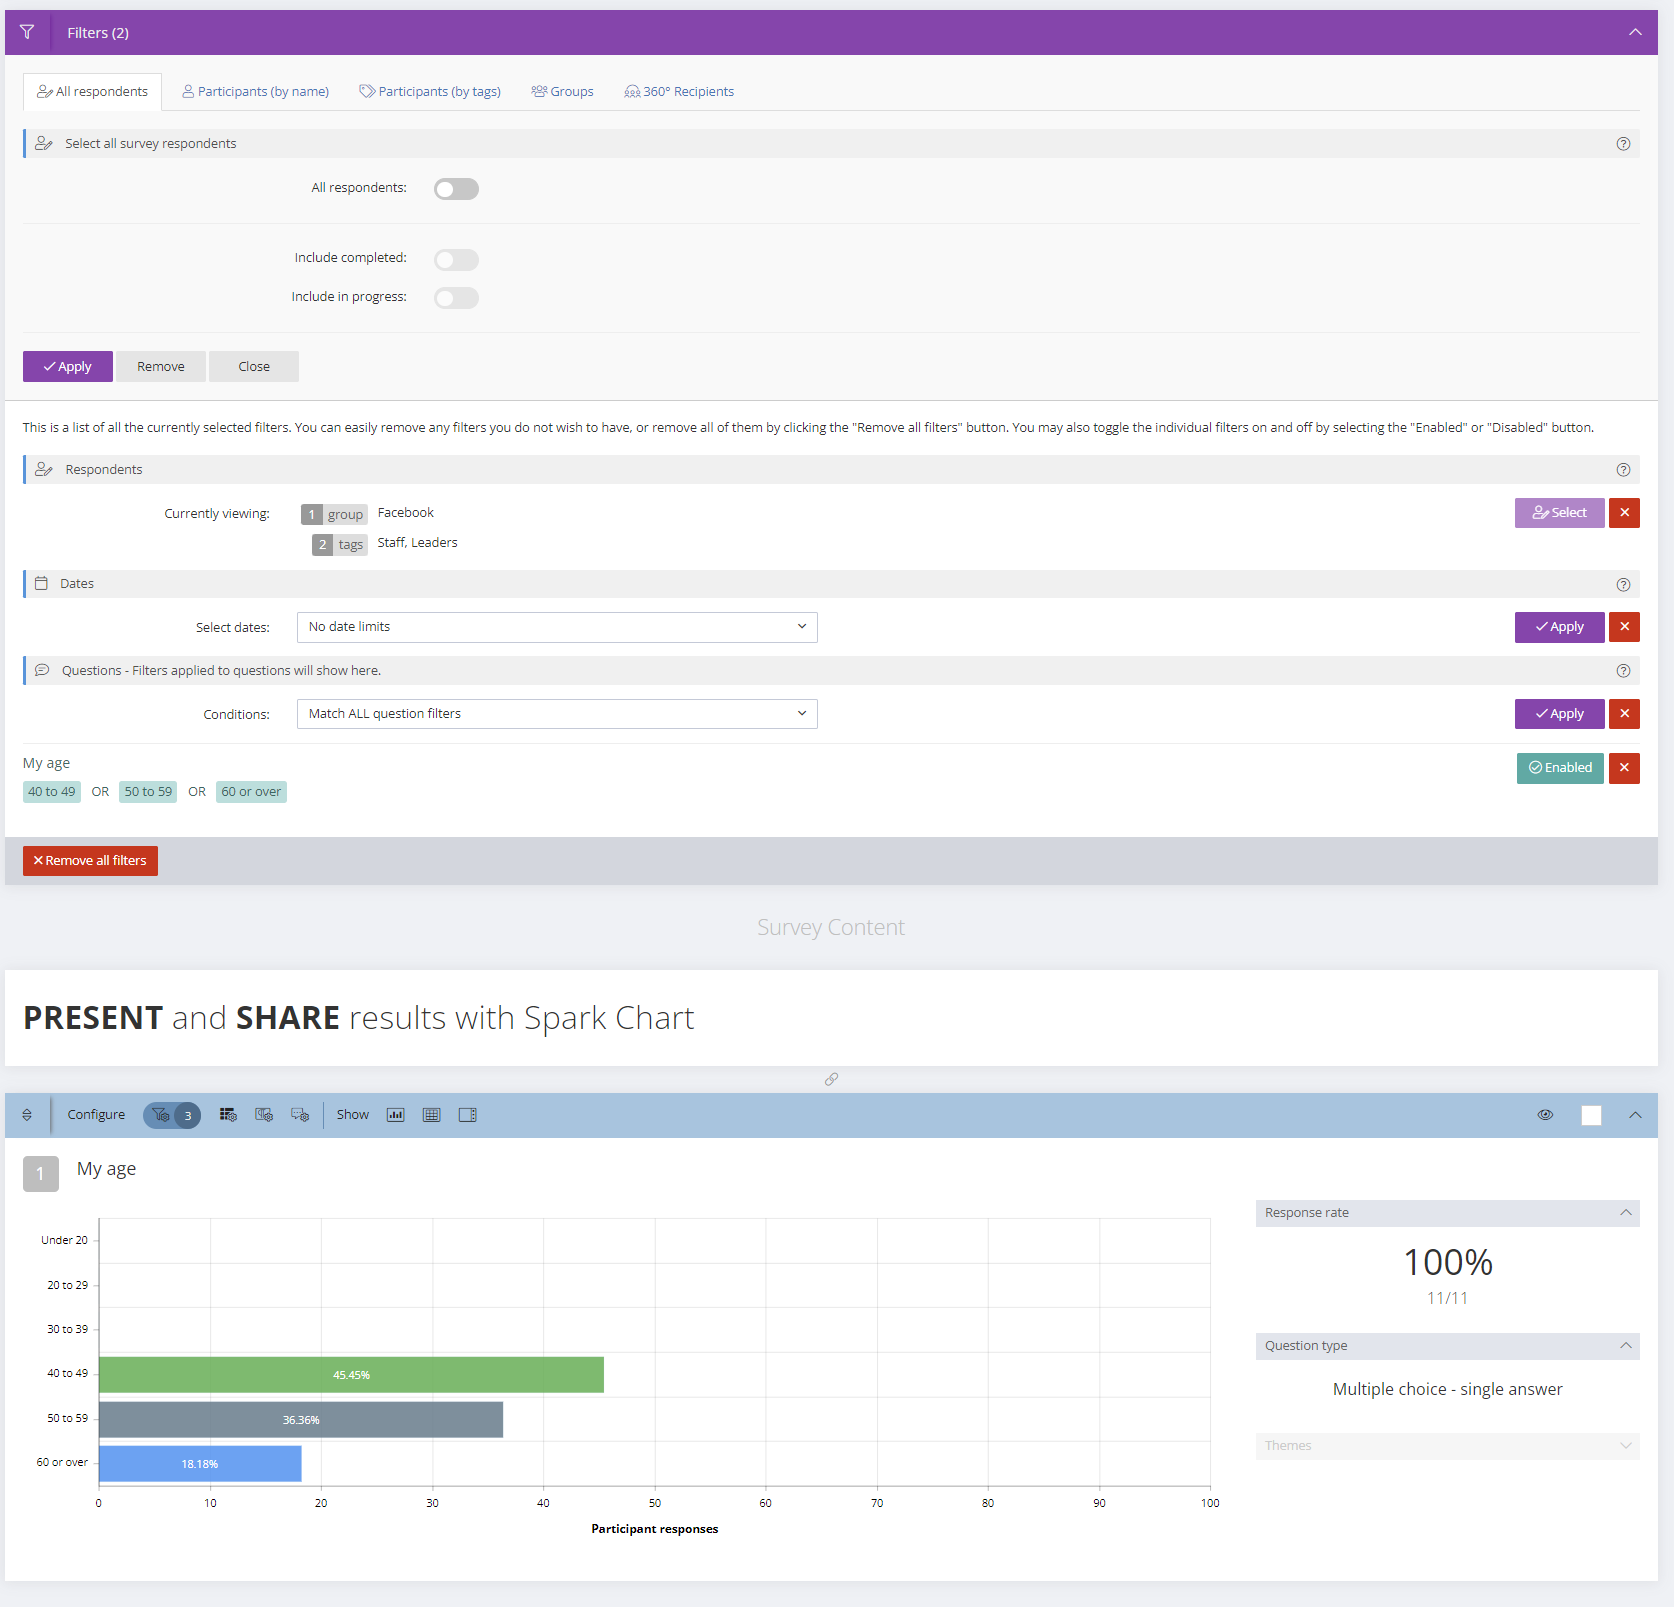
A report can contain all the survey results or it may contain filtered views. Additionally, reports may contain results for all participants or for selected participants or groups. Messages and recommendations can also be added to reports. Reports can be filtered by questions, dates and by respondents. When filtering by respondents there are options to filter by Name, Tags, Group Links and 360 Recipients. When filters are applied, the Filters panel will open at the top of the page and show the filters
When sharing reports using the Report Shares feature, you can control what viewers can filter. There are options ranging from no filtering through to full filtering and multiple options in between.
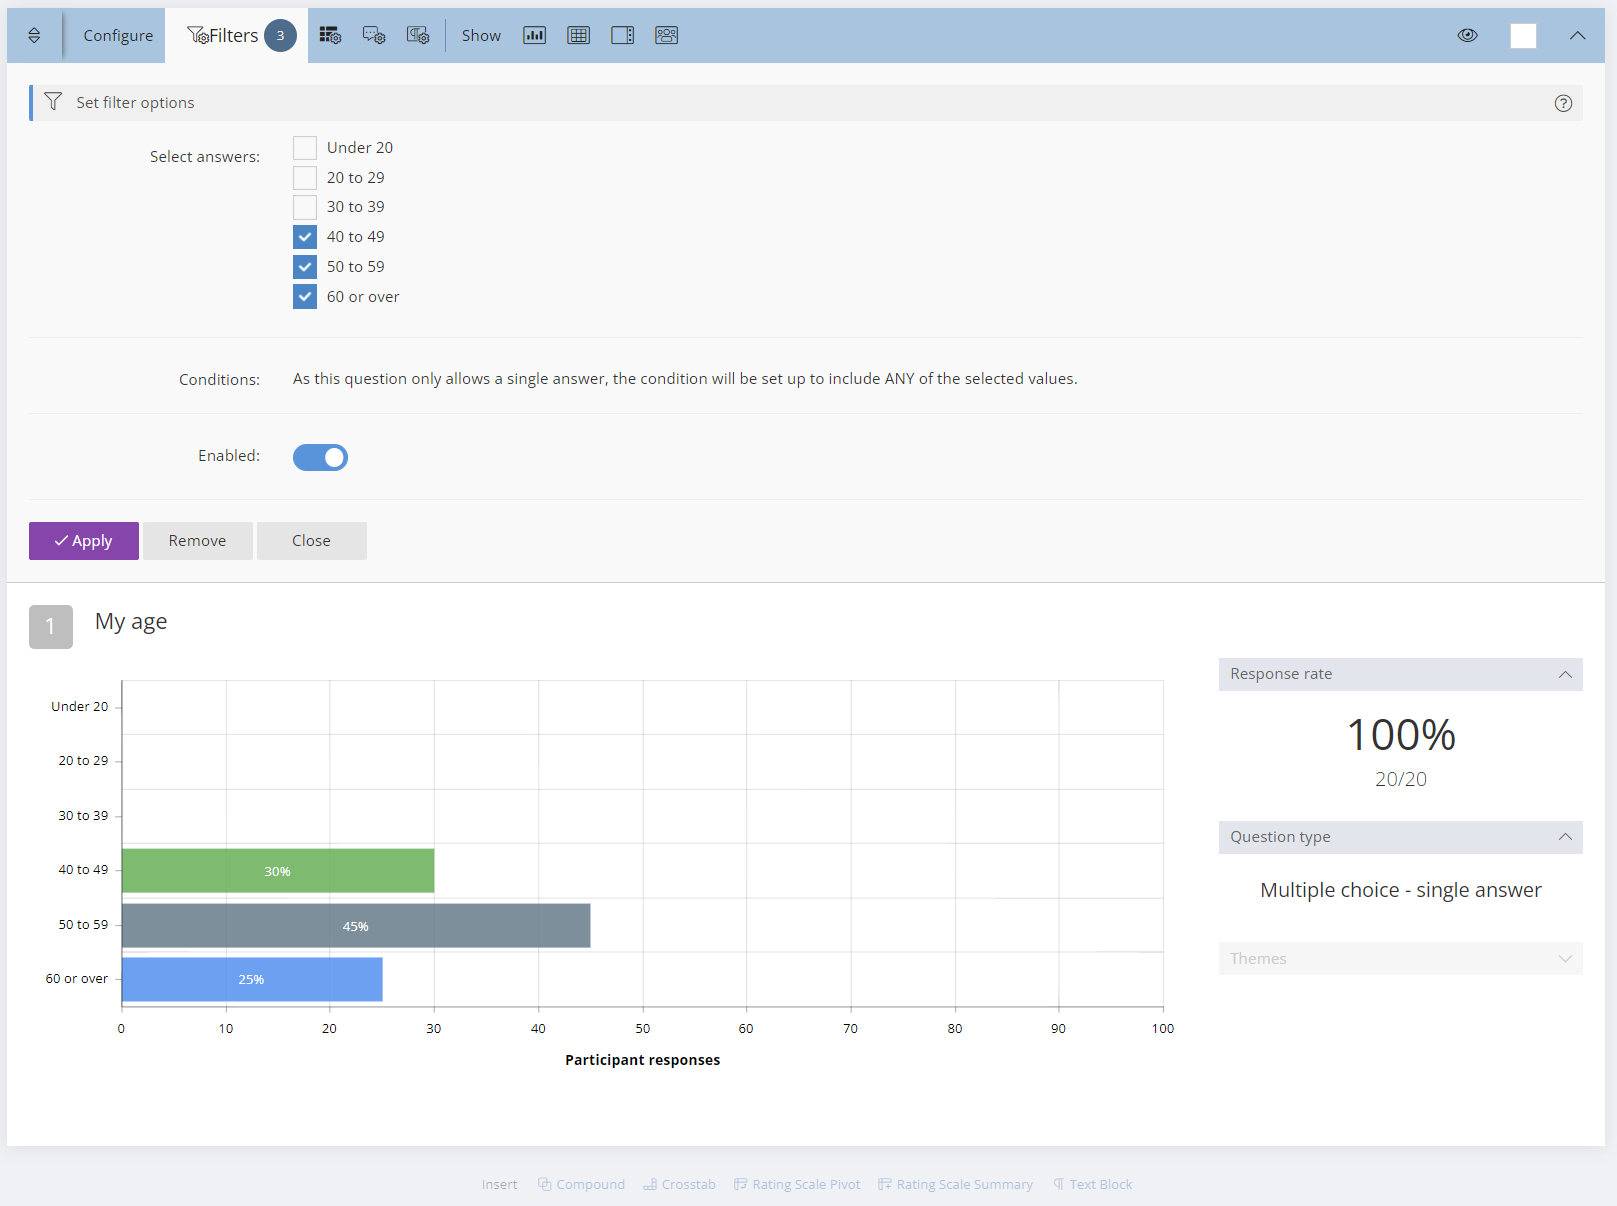
An example of the Filters Panel is show below.

Filter by individual questions
To filter results for individual survey questions, choose the Filter icon and then select the answers to include in the filter. Click Enable and Save. Filters can be enabled for multiple questions.
Filter by repondents
To filter by respondents, expand the purple filters panel (if not already expanded) and select the Respondents filter button, disable the All respondents button, filter by the desired participants (by Name, Tags, Group Links and/or 360 Recipients) and apply.
Filter by date ranges
To filter by date ranges, open the purple filters panel, select the desired date range and apply.

Add Dynamic Report Items (Compounds, Crosstabs, Rating Scale Summaries & Rating Scale Pivots)
Adding dynamic report items - Compounds, Crosstabs, Rating Scale Summaries & Rating Scale Pivots - is easy with the floating toolbars. Between each question panel in the report is a set of buttons allowing easy insertion of a new item at that location. These dynamic items can also be added using the Add button at the top right of the report.


Crosstabs (Cross Tabulation)
Cross tabulation (or crosstab) reports are used to analyse the relationships among the responses to two or more questions. The crosstab presents data in a table with the x-axis presenting the responses for a selected lead question and the y-axis mapping the responses from the target question against each of the responses to the lead question.
Cross tabulation helps to identify the relationships within survey results. Crosstab tables record the number (frequency) and percentage of respondents that have the specific characteristics described in the cells of the table. They allow close investigation of the relationships within a set of survey responses that might otherwise not be evident.

With the crosstab feature, users first select a lead question followed by the target question for cross tabulation. Multiple crosstab tables can be created for a single lead question by selecting multiple target questions. When multiple target questions are selected, a summary table will show at the top, followed by crosstab tables for each selected target question.

Layout options can be configured from the Configure/Layout icon.

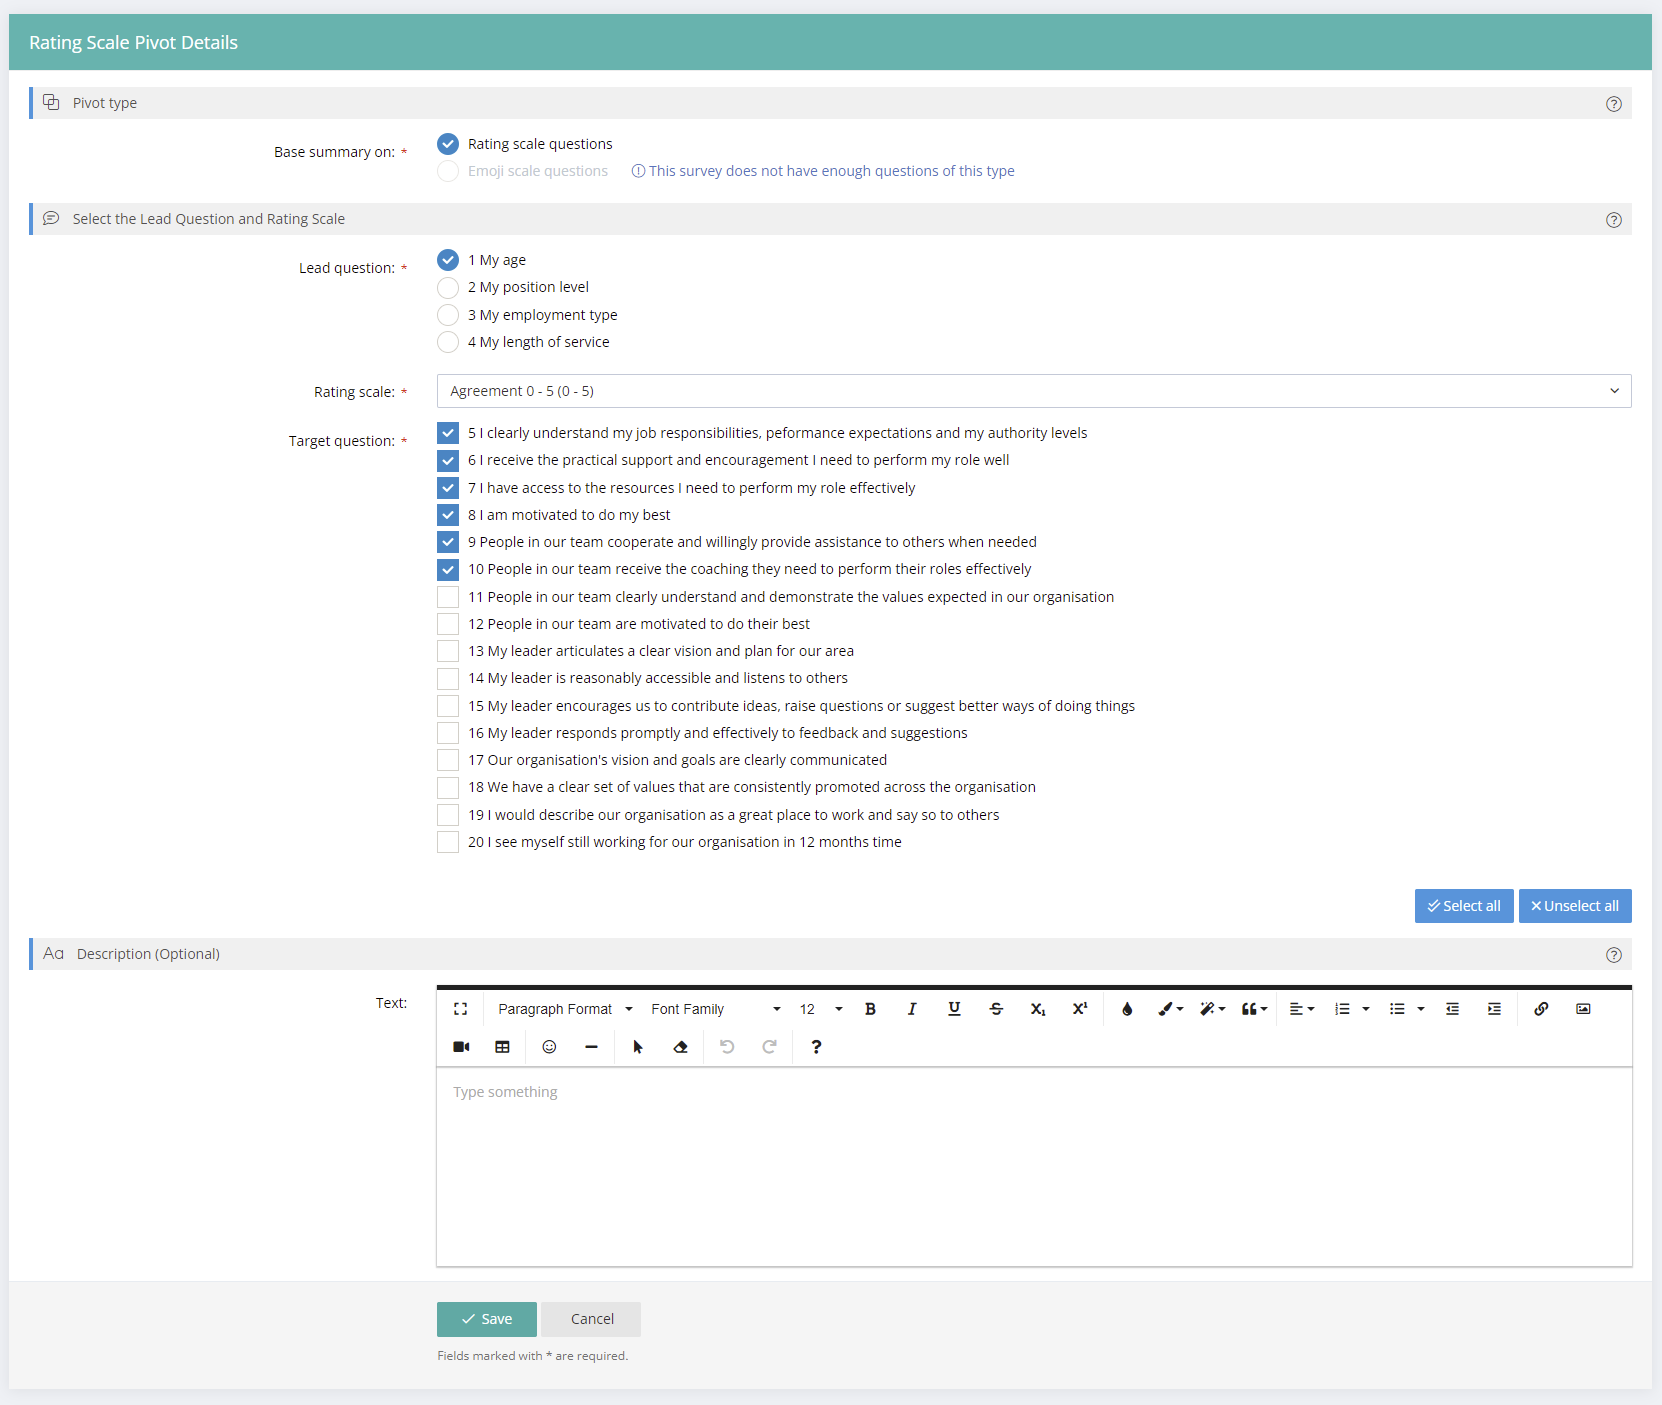
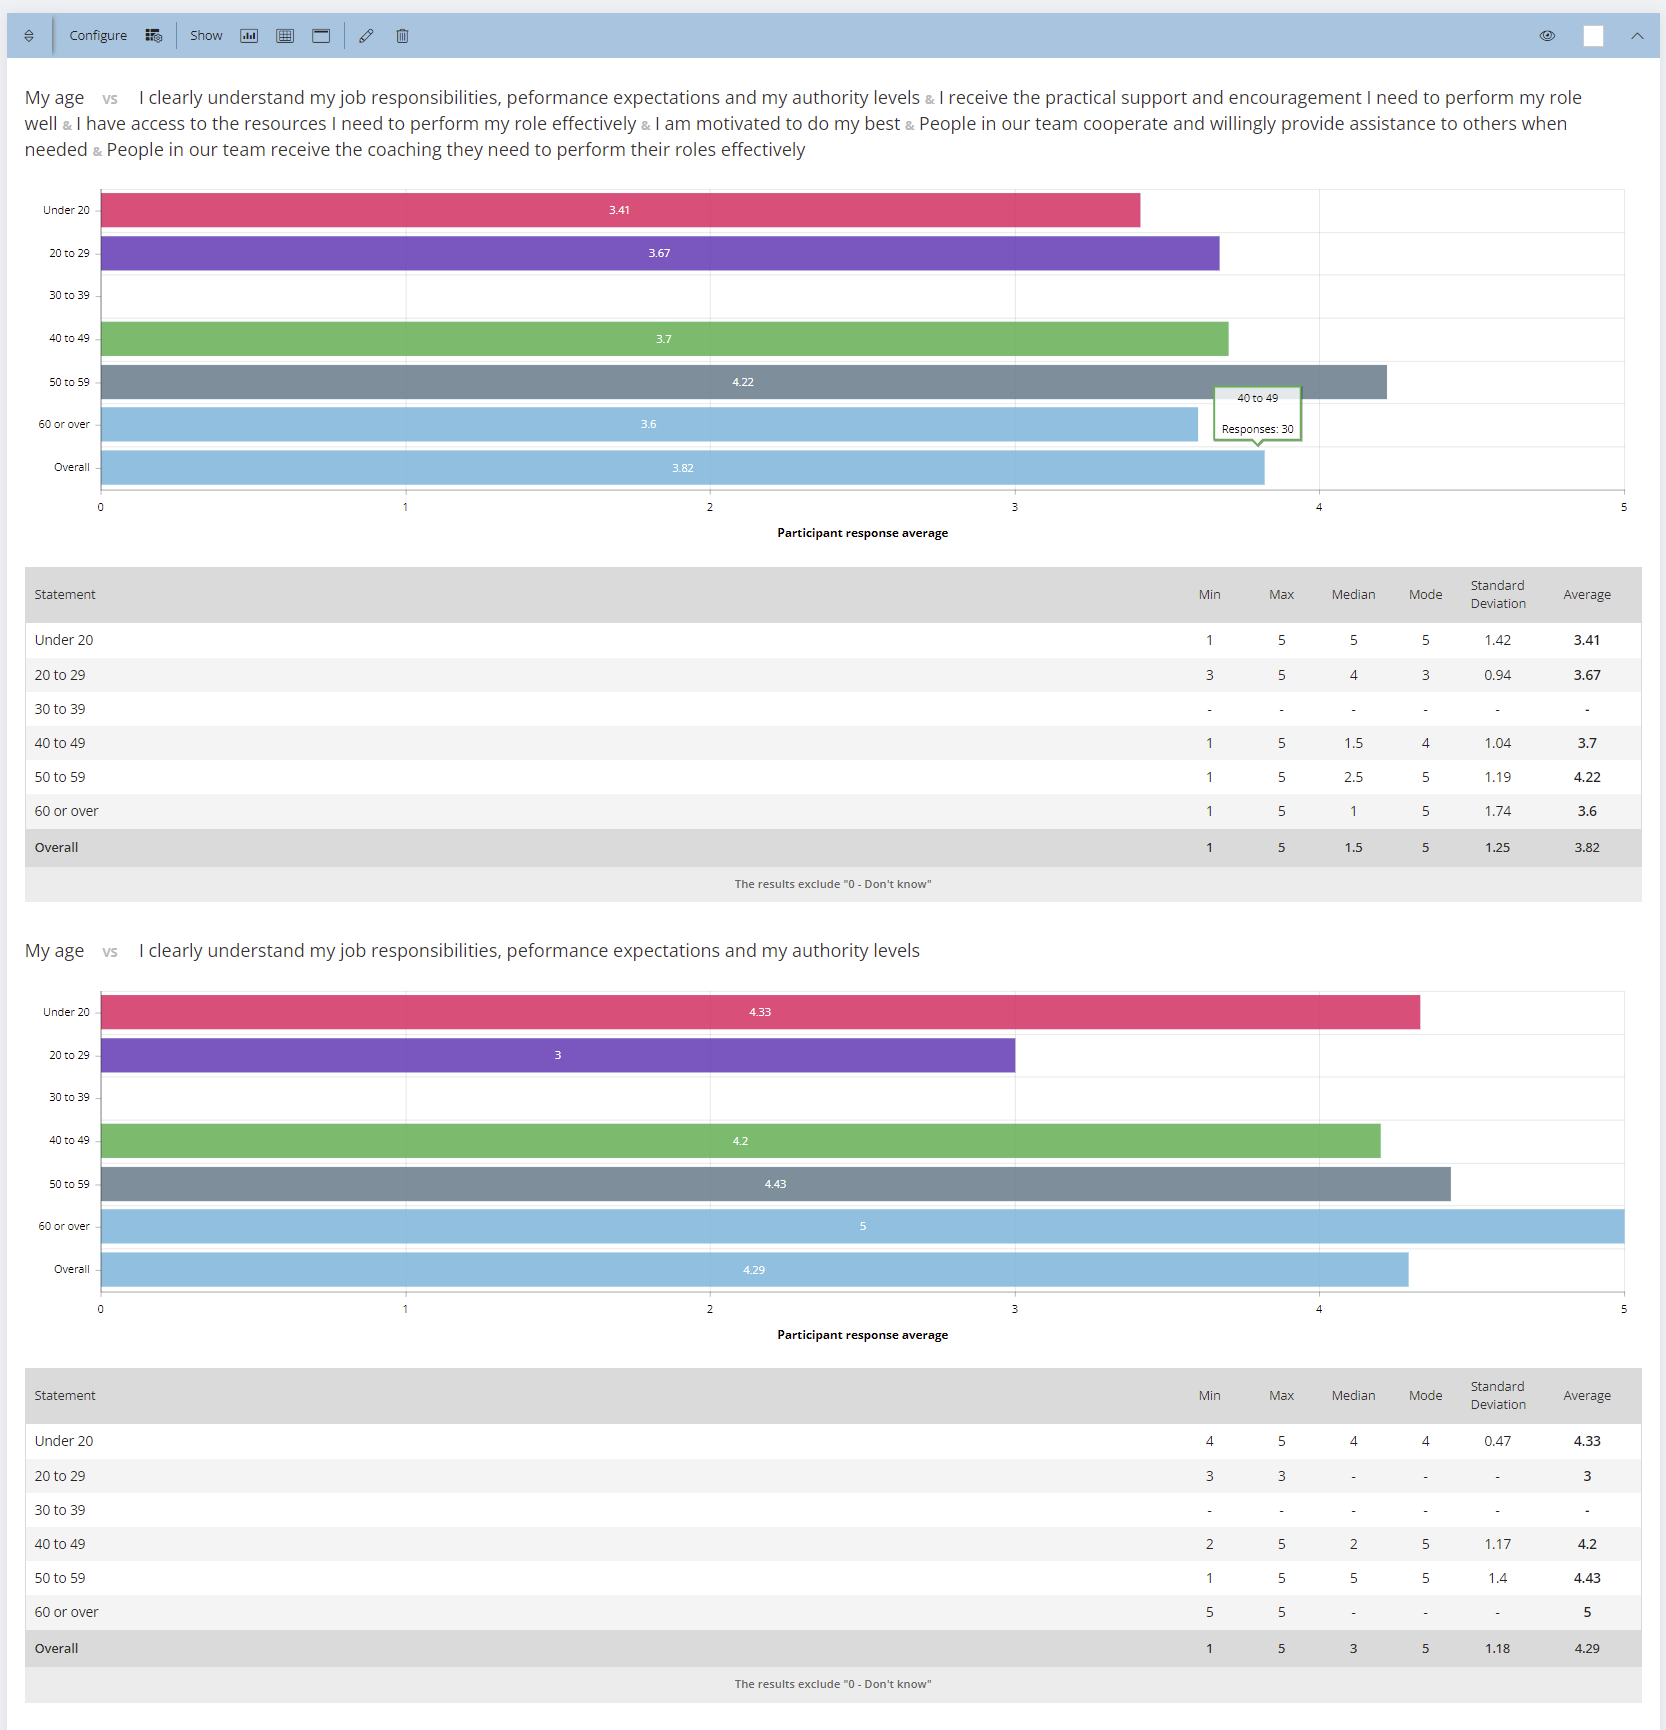
Rating Scale Pivot
Rating Scale Pivot reports can be used to compare the responses to a lead multiple choice question against responses to selected rating scale or emoji scale questions.
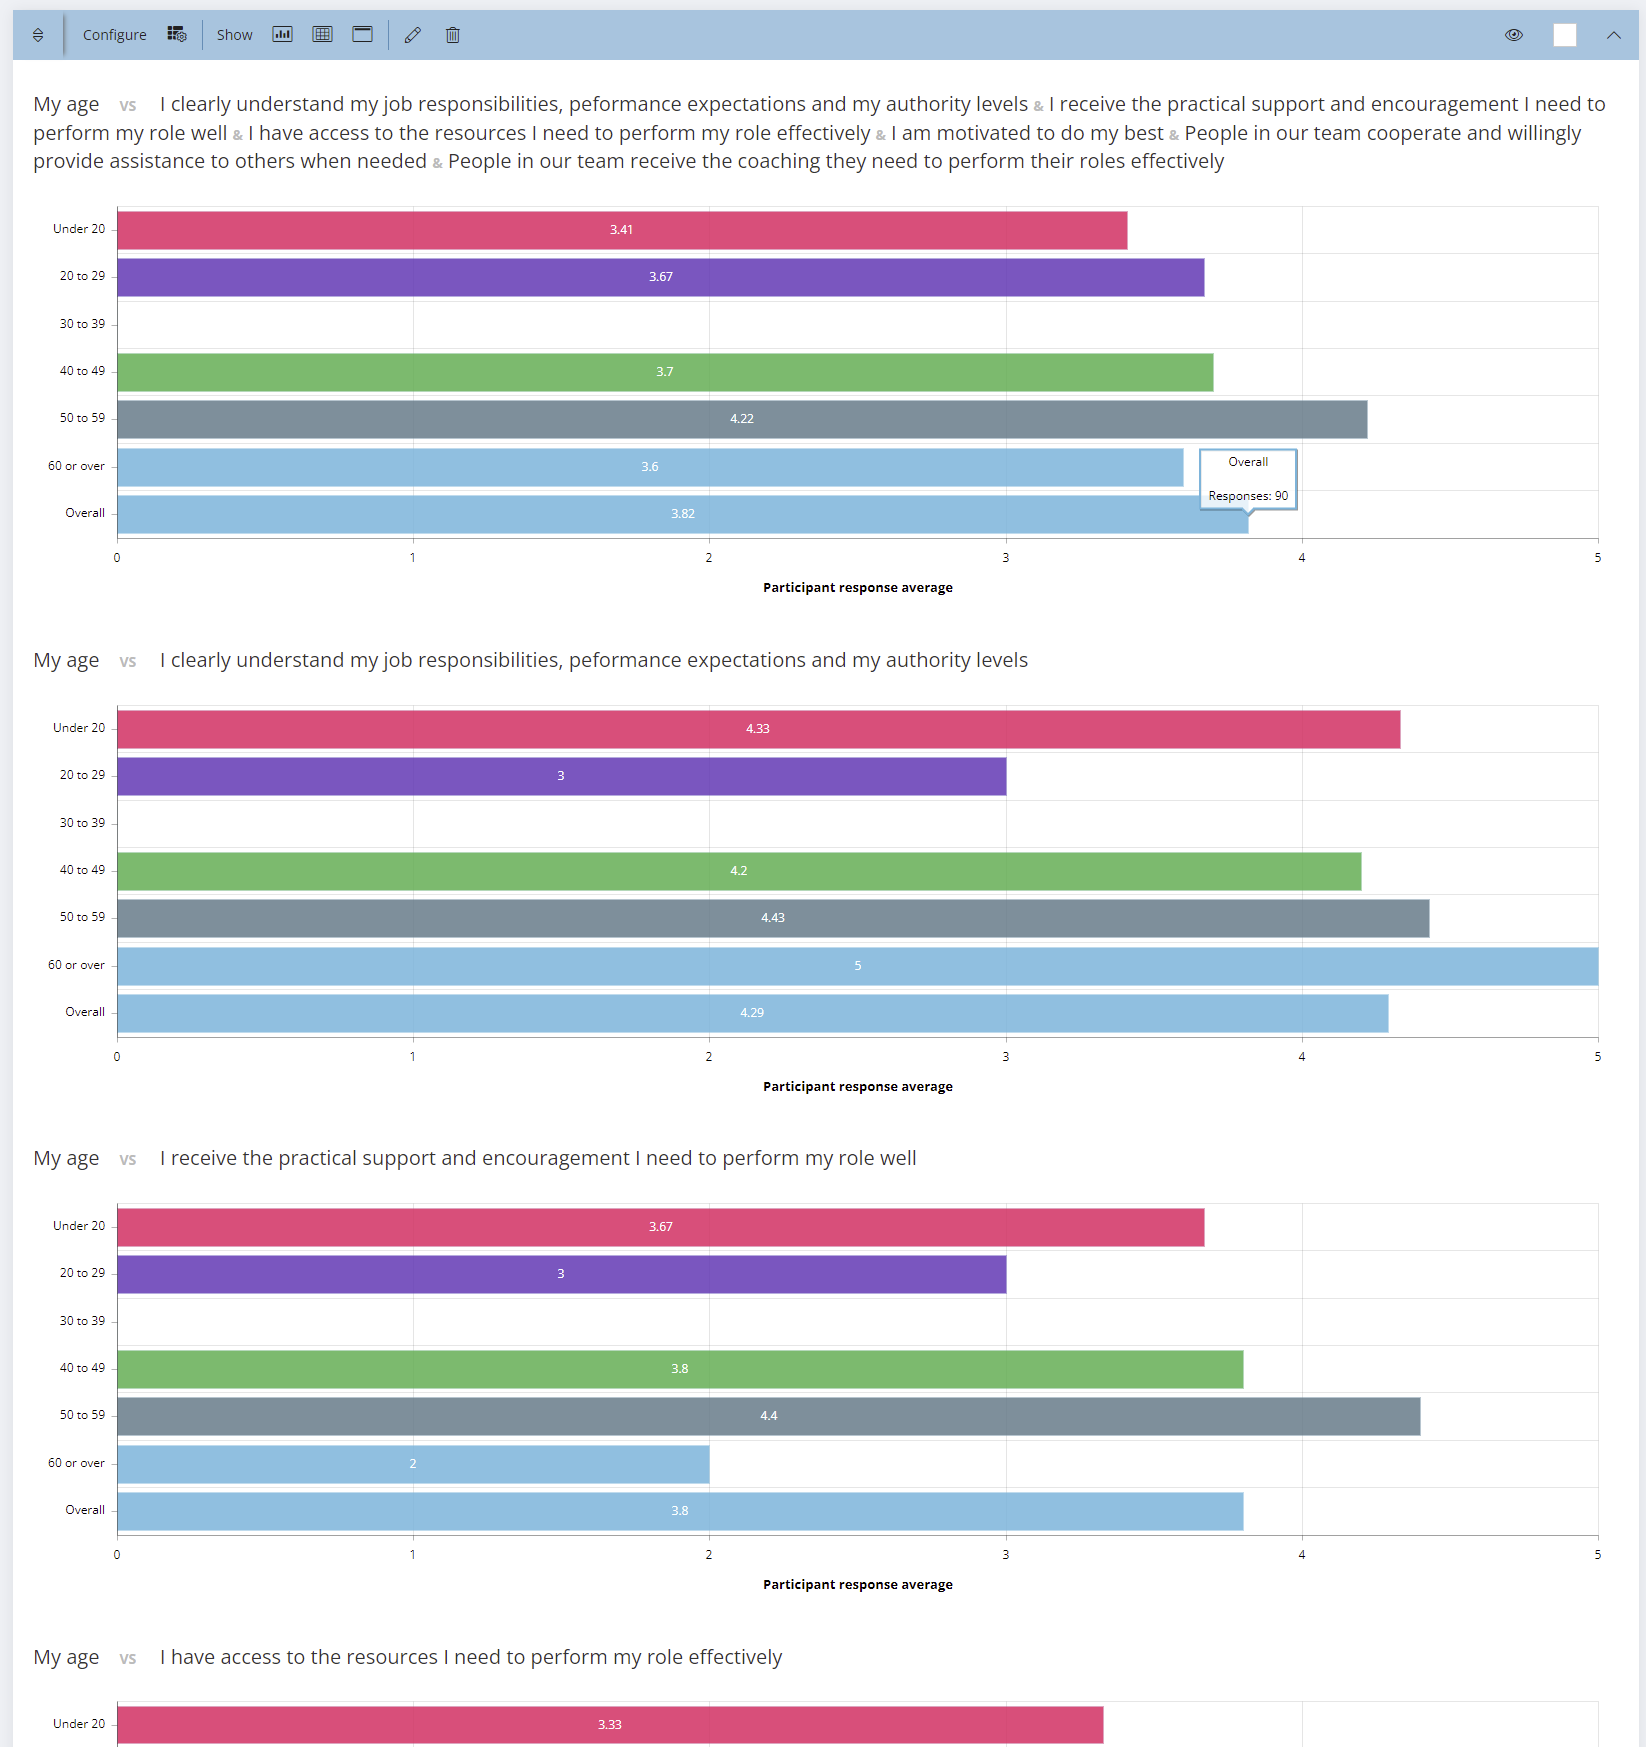
First select a pivot type (rating scale questions or emoji scale questions). Then select a lead multiple choice question, followed by the target scale and questions. The selected rating scale or emoji scale questions will be presented in charts (with an option to show tables) and present the average for each lead question response option against the scale options. A summary chart will show at the top, followed by charts (and table options) for each Rating Scale question.
A use case example is a 360 degree feedback project. The lead question might be the relationship that a respondent has to the 360 degree feedback recipient (e.g. manager, colleague, direct report, self, other). The target questions could then be about the 360 recipient's performance against the scale for specific expected competency or behaviour questions. The Rating Scale Pivot would present charts and tables showing on average how each relationship group in the lead question responded against the scale for each target question.
The layout of the Rating Scale Pivot can be customised from the Layout icon. There are options to set the sorting order, data precision, chart type, chart colours and table options.
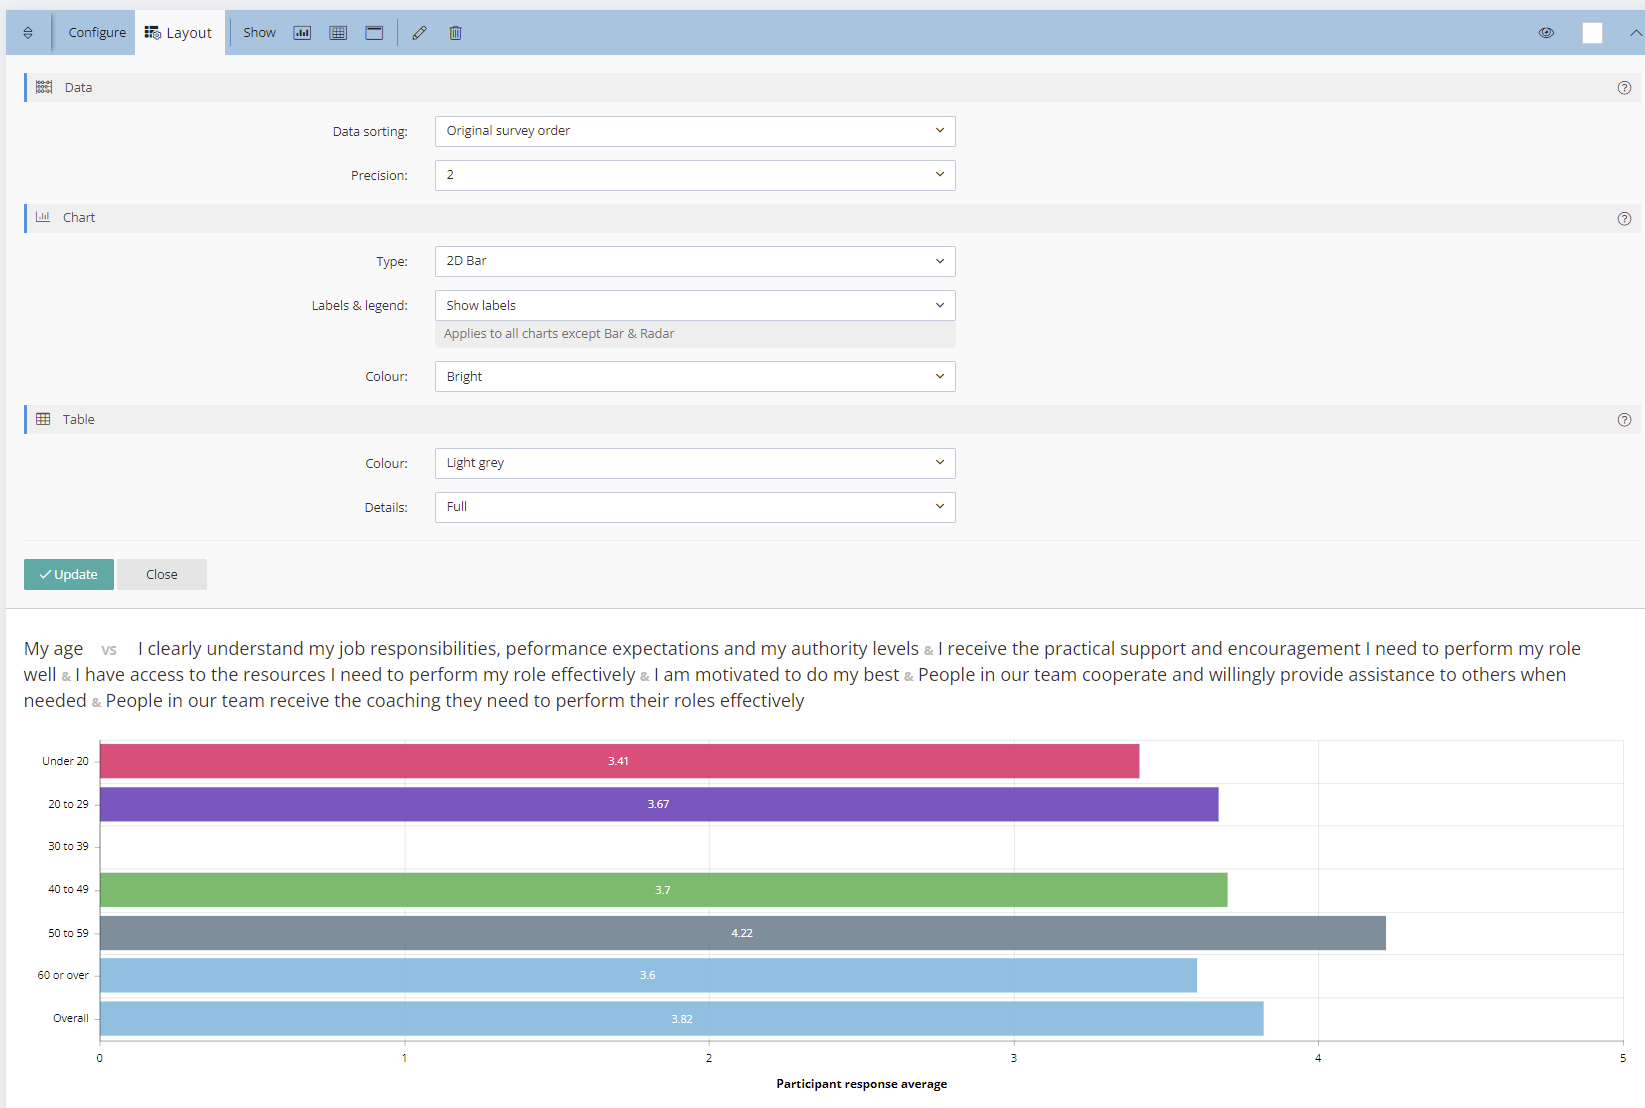
The Rating Scale Pivot can be presented in chart or table format or both.
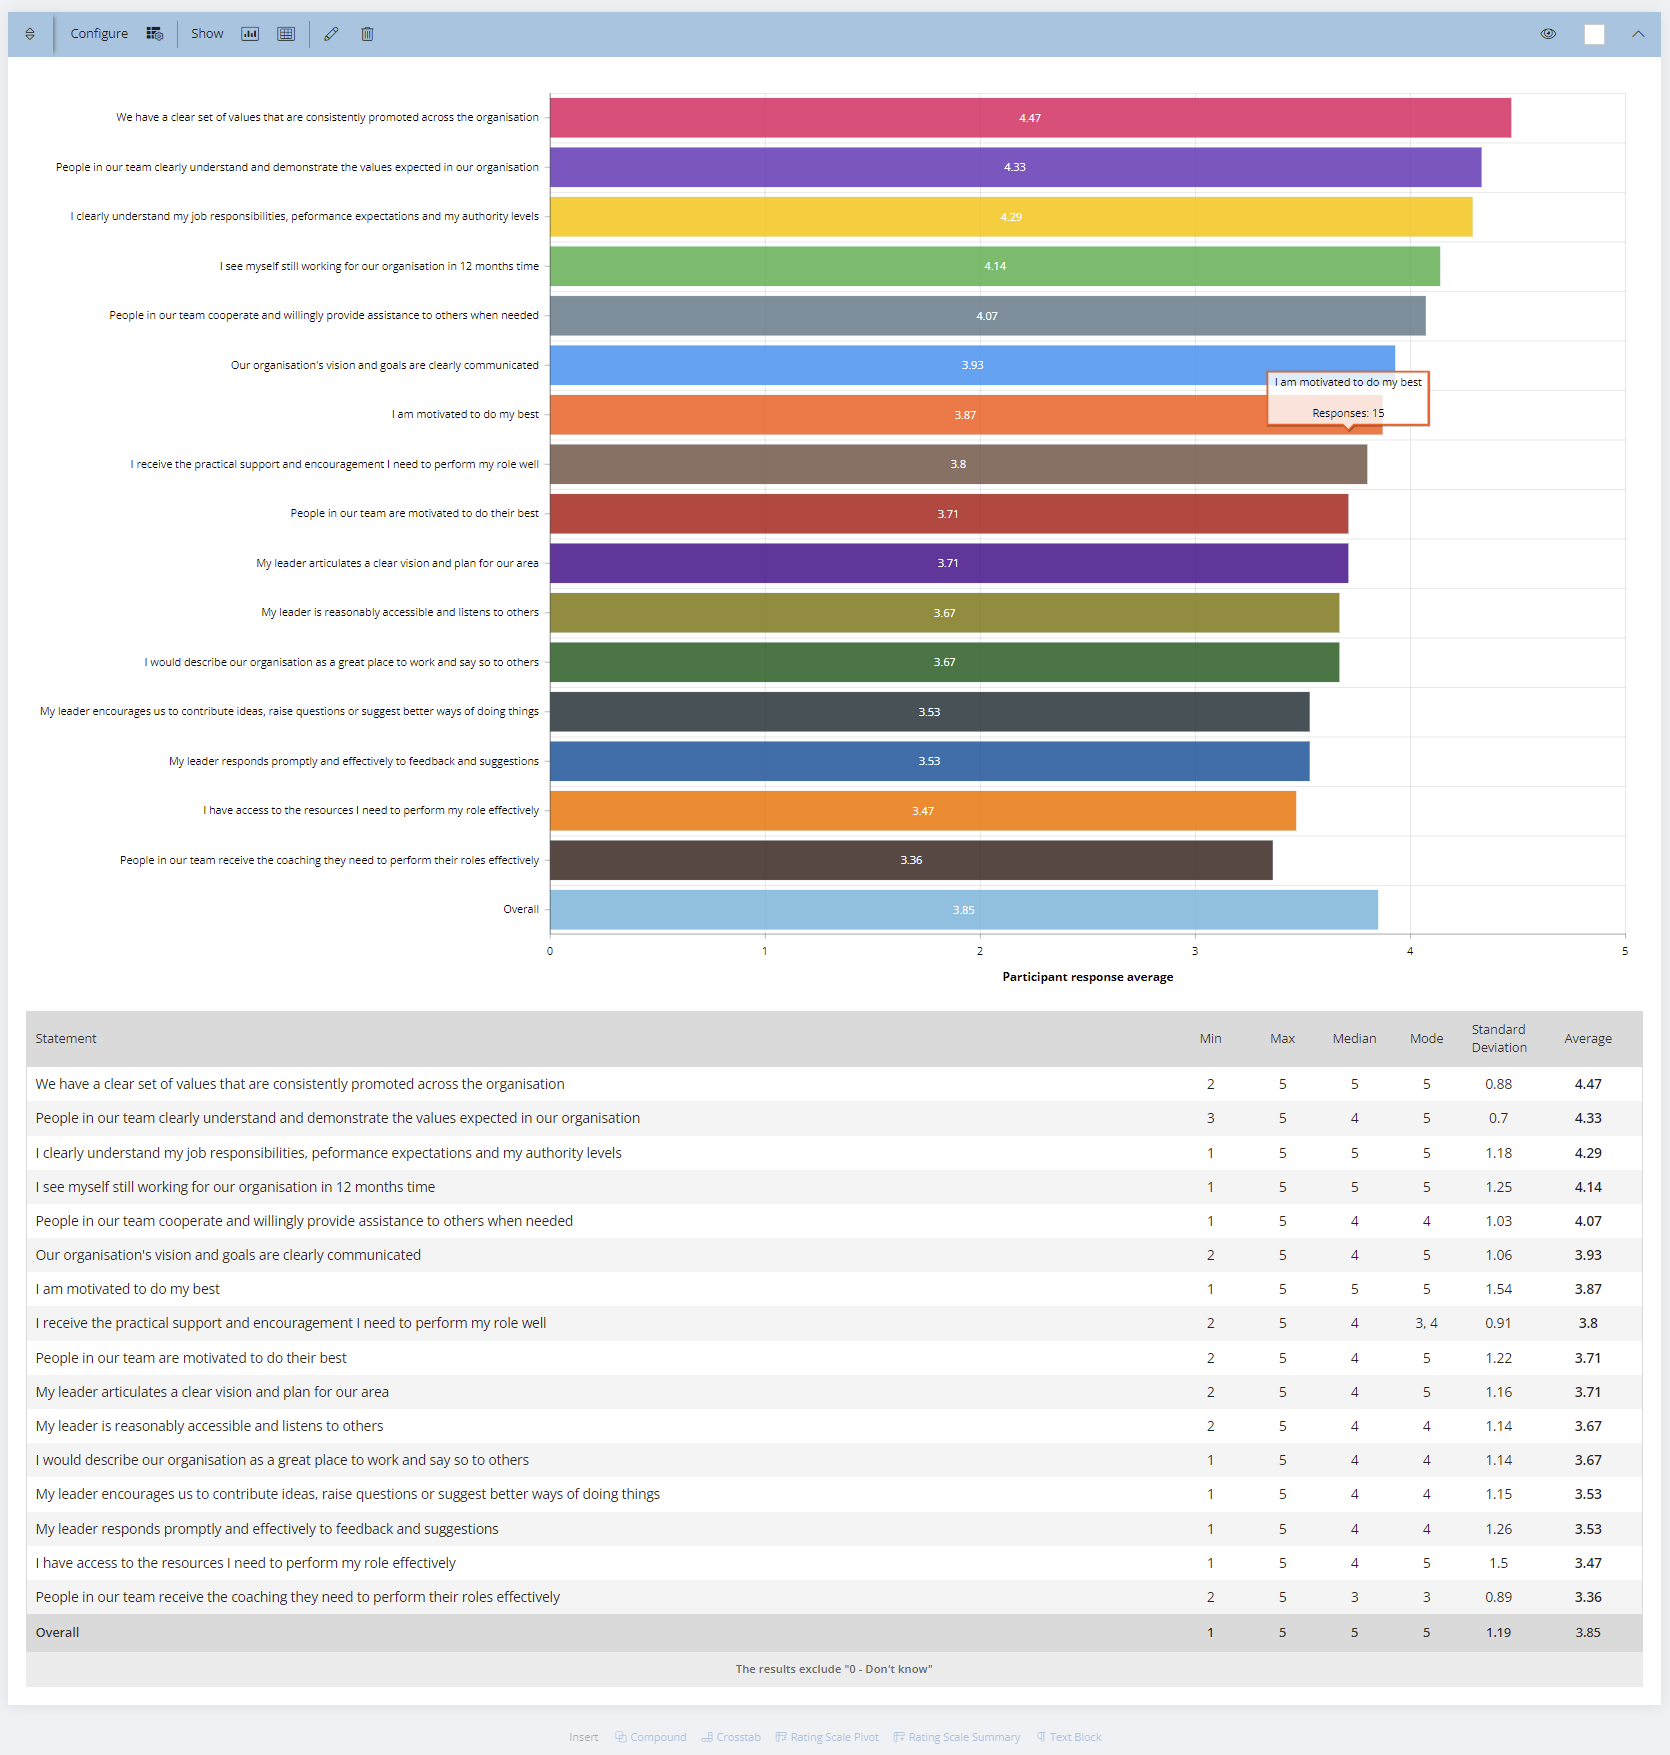
Rating Scale Summary
A Rating Scale Summary compares the average data between questions in a single chart. By selecting a Rating Scale (or Emoji Rating Scale) and two or more questions, you will get an accurate comparison of the responses for the questions, as well as an overall average for all your selections.

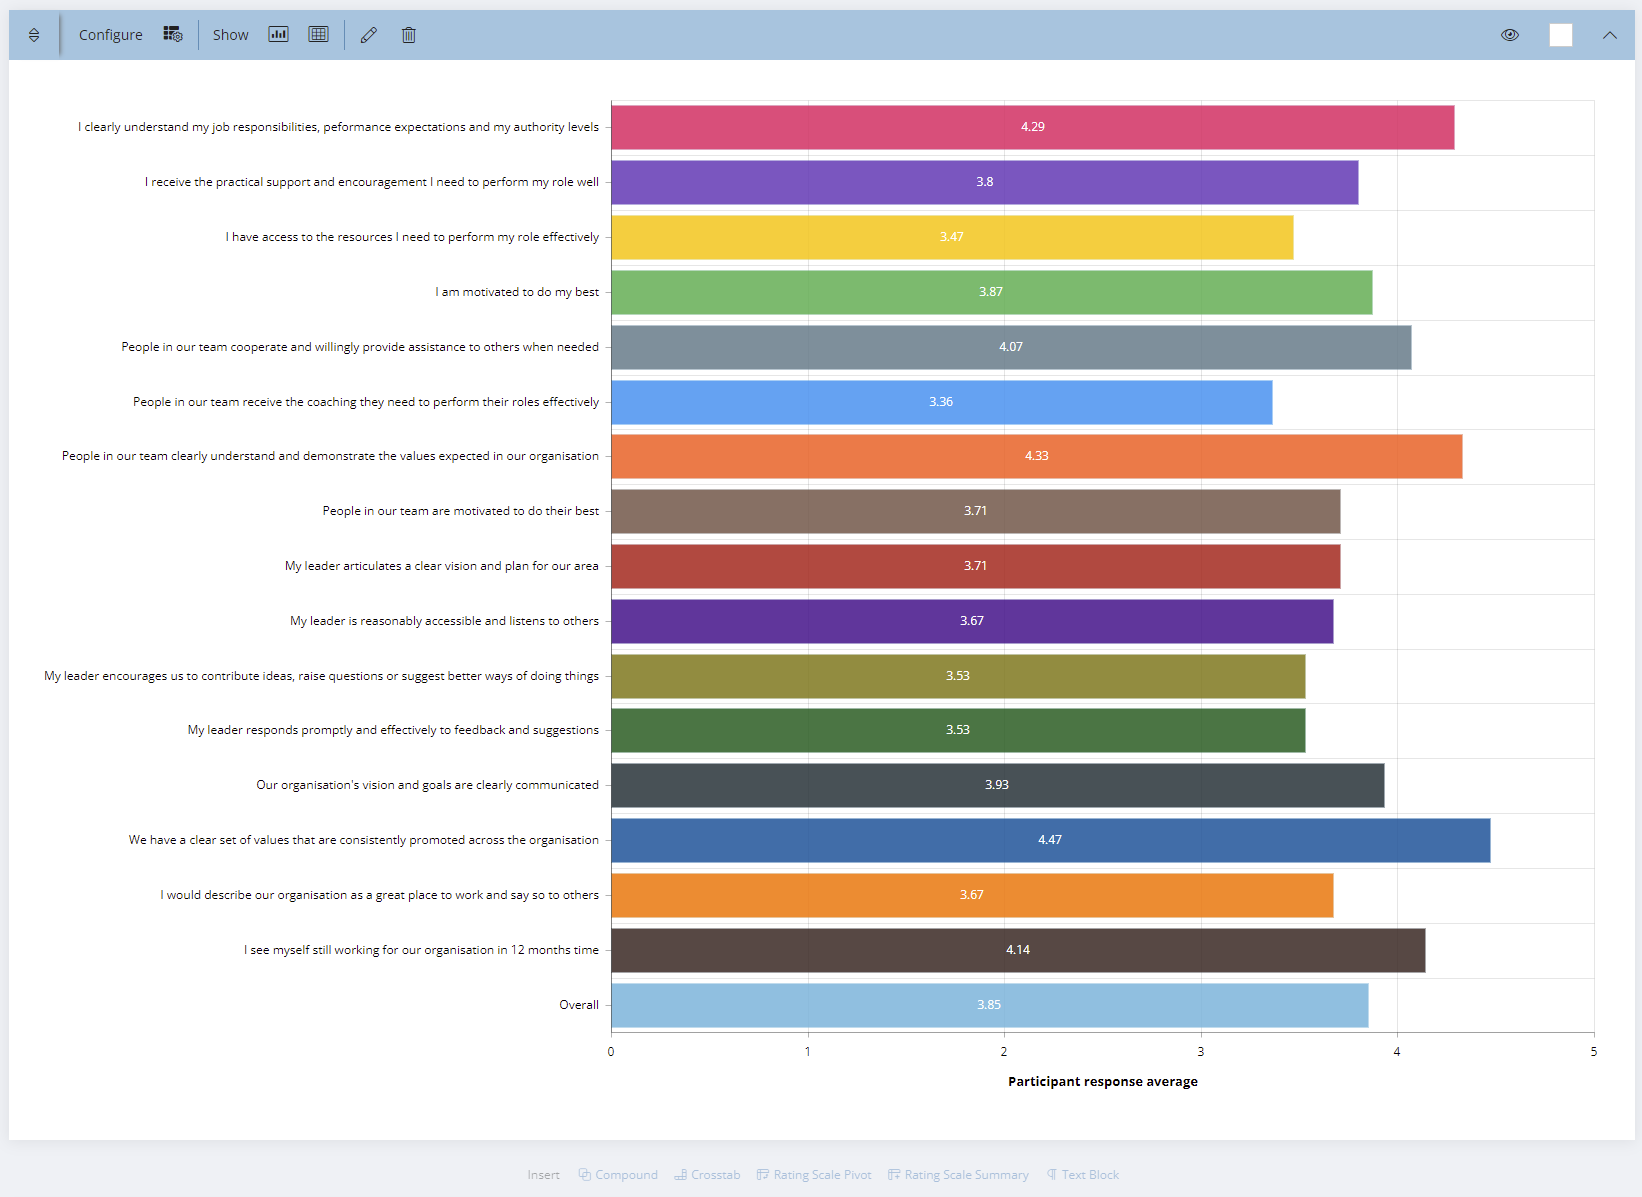
The layout of the Rating Scale Summary can be customised from the Layout icon. There are options to set the sorting order, data precision, chart type, chart colours and table options.

The Rating Scale Summary can be presented in chart or table format or both.
Compound Charts
A Compound Chart aggregates results for selected Rating Scale questions, Answer List questions and Emoji questions. Compound Charts are created from the "Floating Toolbar" or the "Add" button at the top of reports. Statistics and Data Panel options are available for Compound Charts. Compound Charts will appear when printing reports (unless the hide option is selected). However, they are not included when exported to CSV.
Select the Compound type based on the desired question type. Then select the content scale or answer List type. The title for the compound chart can be added using rich test.
Then select the questions to be aggregated.
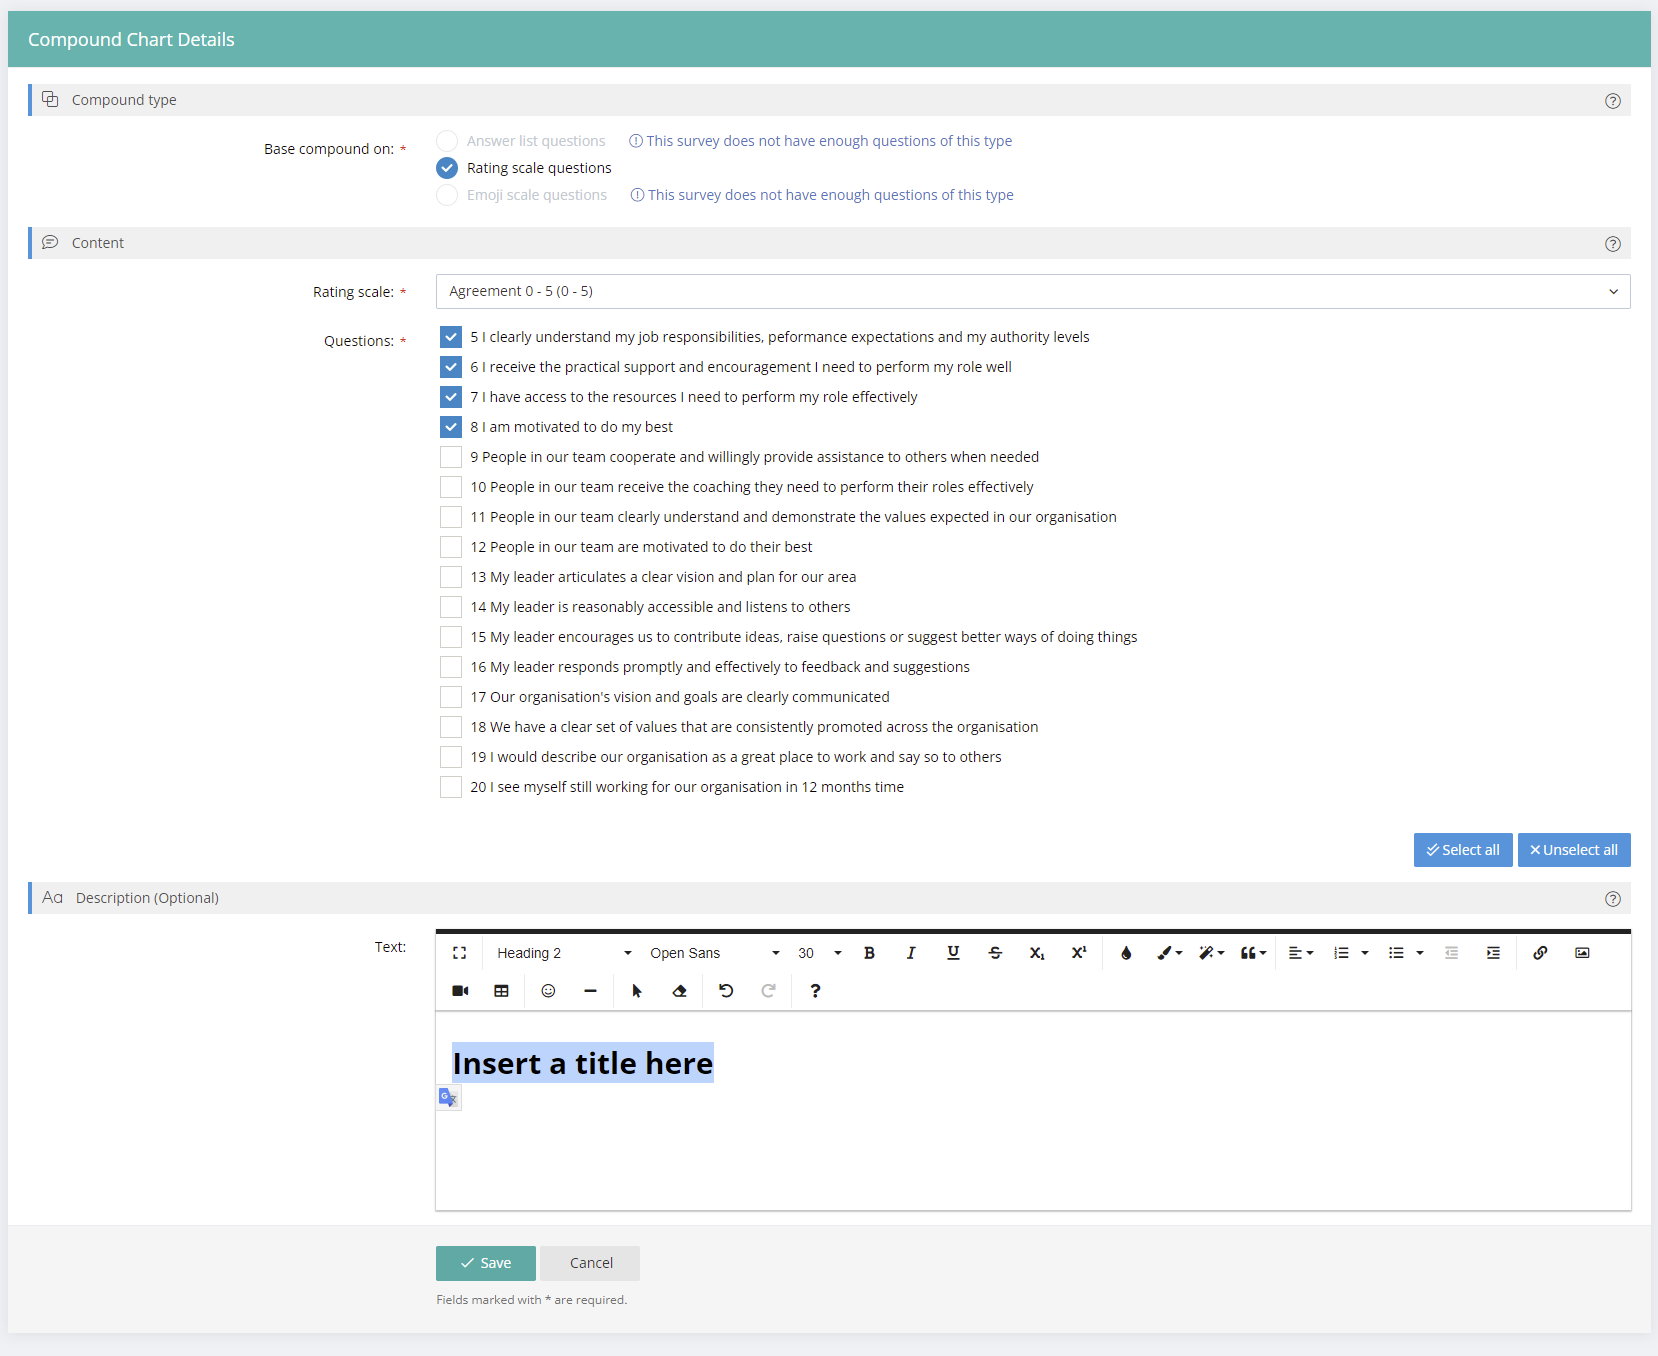
The compound chart can be dragged and dropped anywhere in the report using the arrow up/down icon at the top left. By default, the questions included in the compound chart are shown above the chart/table. This can be turned off by selecting the "Toggle question caption" icon.
Print or Export Reports (including creating PDF and Microsoft Word versions)
Survey results can be printed from the Reports Menu. There is a Print Button alongside each report. There is also a Print Button in the top right menu when editing a report.
Print will bring up a print version of the survey results which can be either printed or saved as a pdf. Most browsers have advanced settings to make adjustments depending on the layout of the report being printed.
Print to Microsoft Word can be achieved by simply saving the report as a pdf first and then opening the pdf document with Microsoft Word.
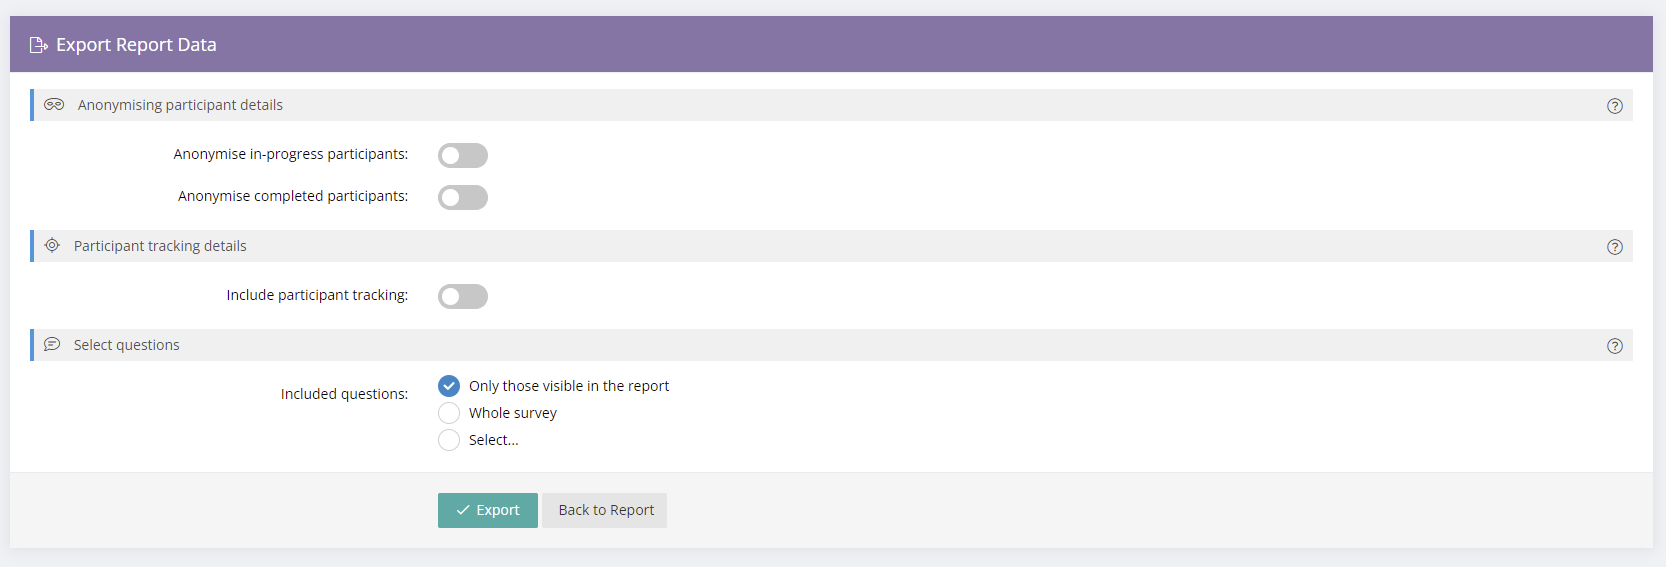
You can export the data contained in a report in CSV format. To do so, create the report and, while viewing the report, click the Export button on the toolbar.

On the export screen, you will be able to select a number of options:
Anonymise completed participants
This will allow you to remove any participant names & email addresses from those who have completed the survey. Please note that this option is only available to users with an Administrator level.
Export all (or selected) questions
If you don't wish to export all of the question data, you may select which questions are included in your export.
Once you have selected the desired options, click the Export button at the bottom. The CSV file will be automatically downloaded by your browser.
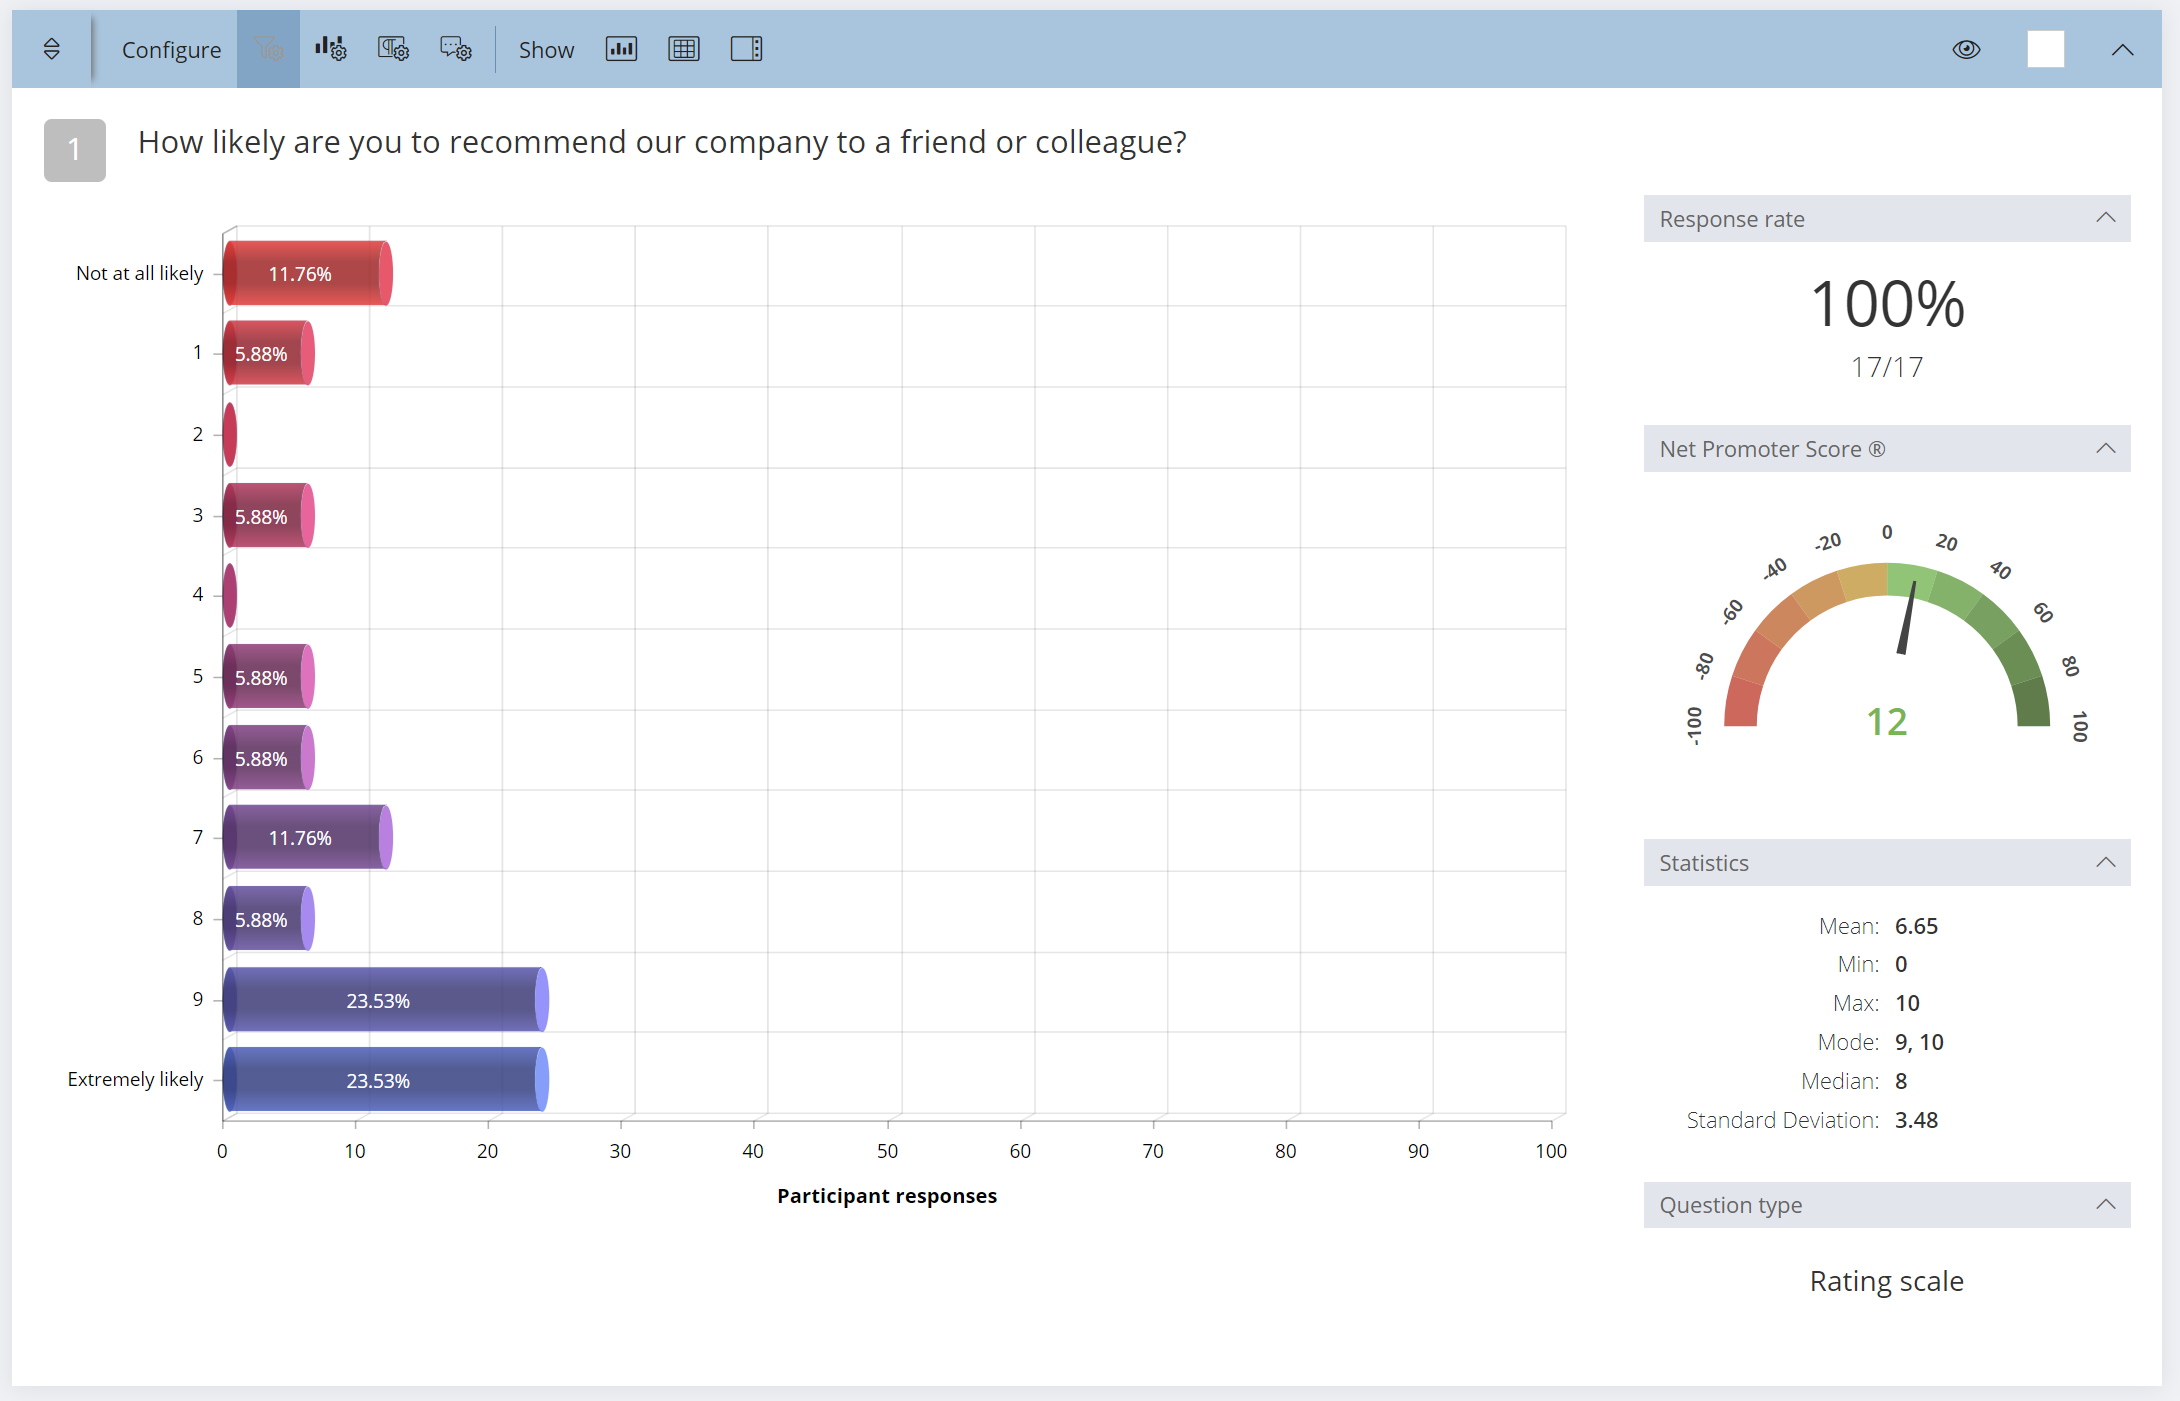
Net Promoter Score – Automatic score calculation and a Gauge in reports
The Net Promoter Score calculates automatically for all Emoji Rating Scale questions that use the NPS scale (RECOMMENDED) and also for normal Rating Scale questions with a rating scale ranging from 0 to 10. A Gauge with a scale from -100 to +100 will show for NPS questions in reports.
Additionally, reports can be filtered by selected dates, meaning NPS can be measured and reported over time to allow comparison of performance between time periods.