

We are very pleased to release our latest major update. The main focus of this release was to enhance the report builder with some advanced items for manipulating your survey results, and give you even more tools to be able to customise them. In addition we've added some new email features and numerous small enhancements to the system.
We're excited by this update and all the new ways you can work with your data and hope you will find these features useful.
Here are the key new features and enhancements.
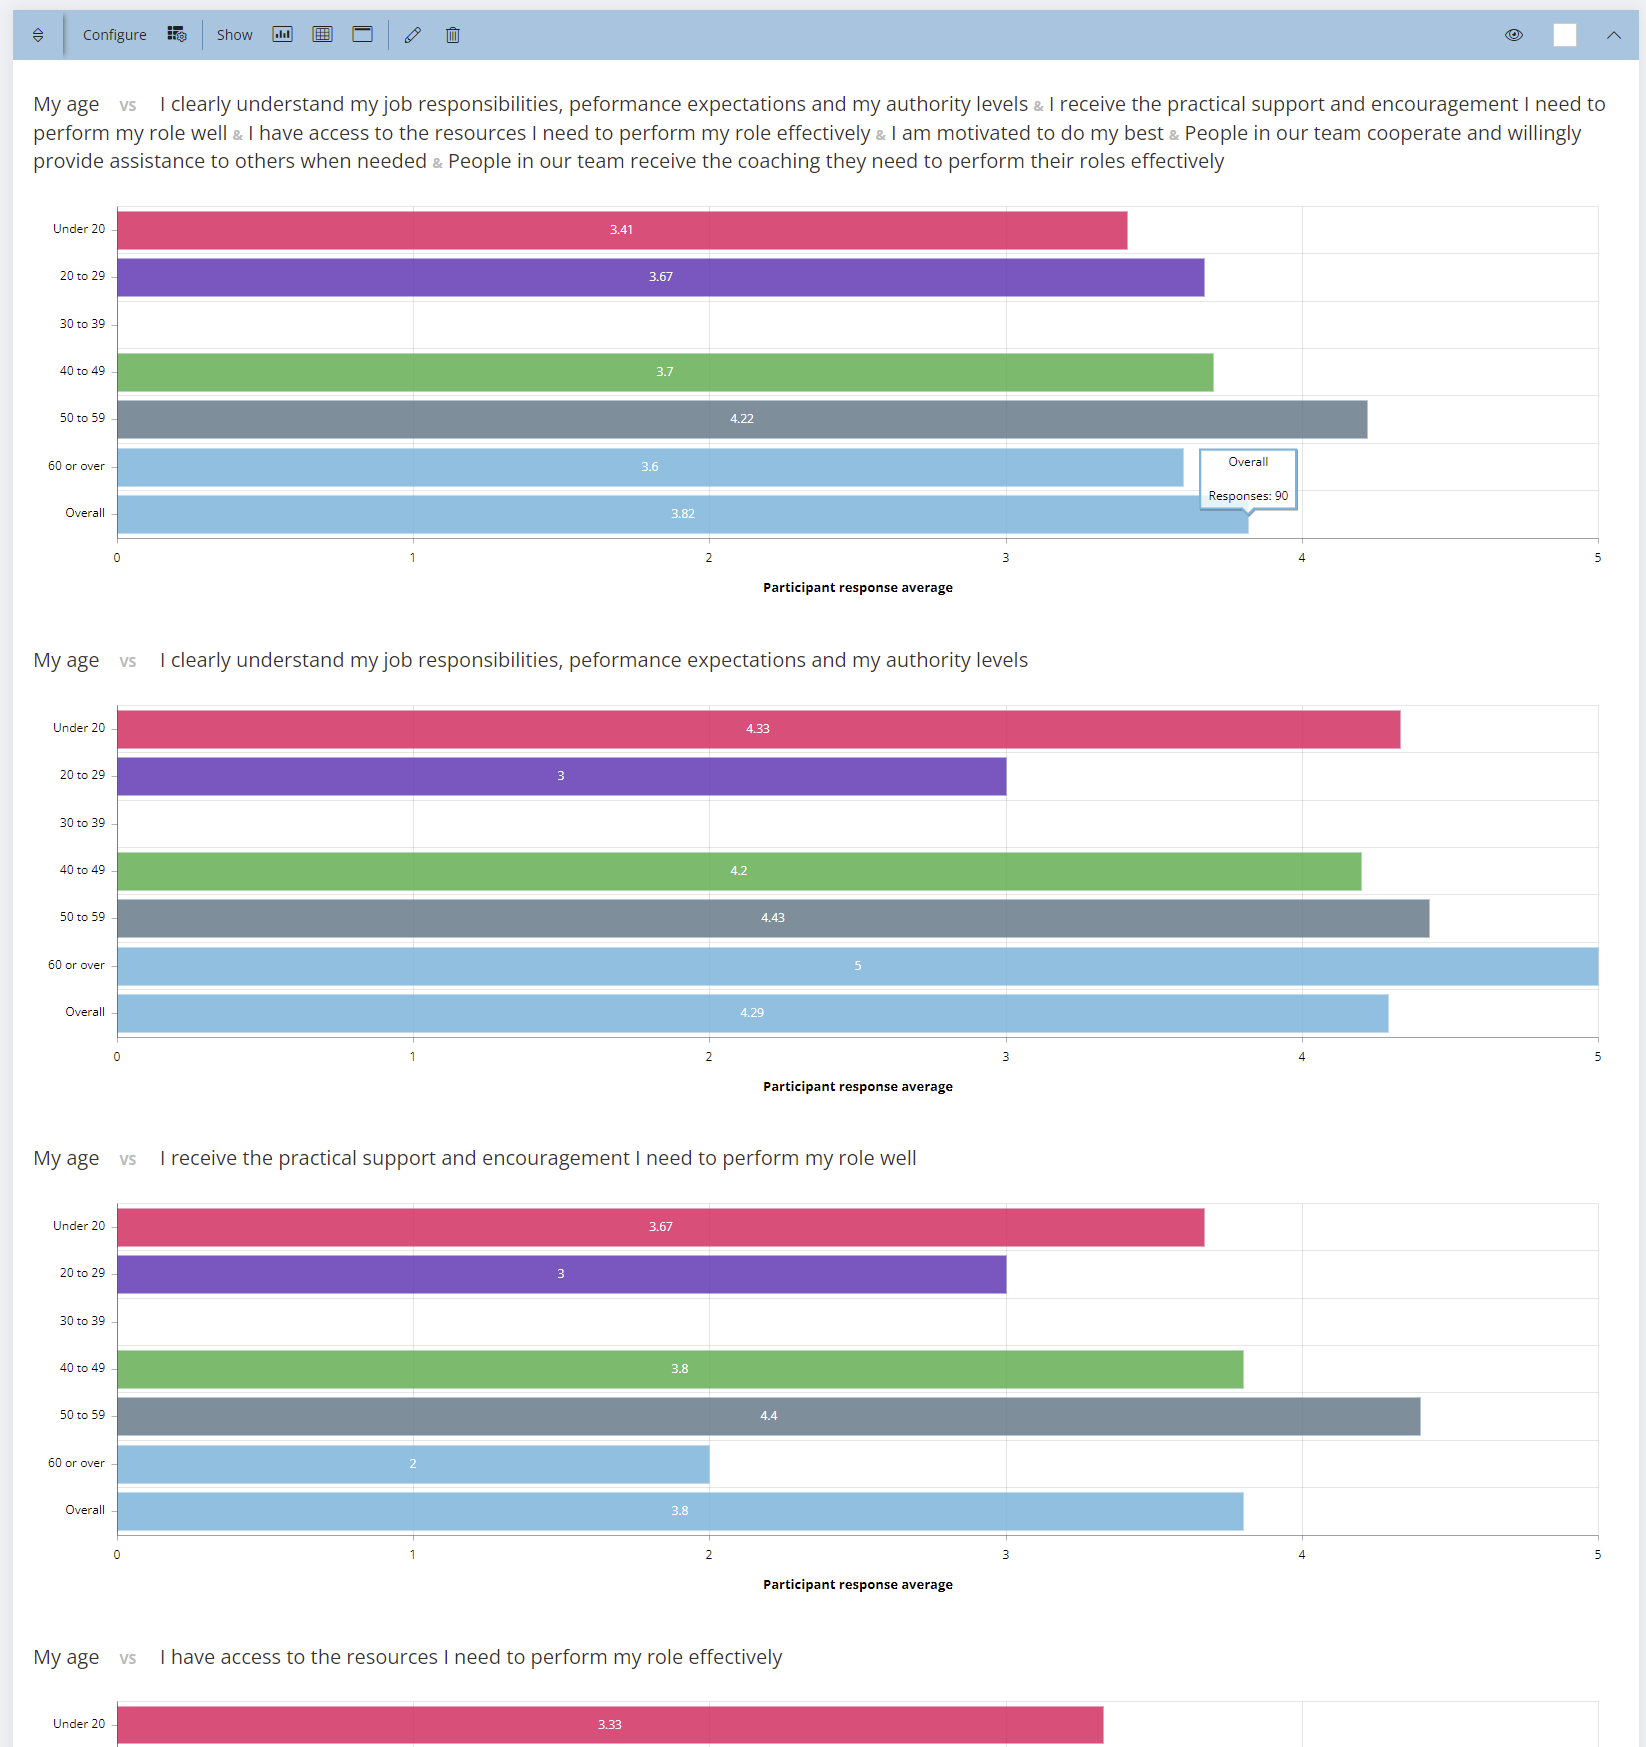
Crosstab reports
Cross tabulation (or crosstab) reports are used to analyse the relationships among the responses to two or more questions. The crosstab presents data in a table with the x-axis presenting the responses for a selected lead question and the y-axis mapping the responses from the target question against each of the responses to the lead question. With the crosstab feature, users first select a lead question followed by the target question for cross tabulation. Multiple crosstab tables can be created for a single lead question by selecting multiple target questions. When multiple target questions are selected, a summary table will show at the top, followed by crosstab tables for each selected target question.
Cross tabulation helps to identify the relationships within survey results. Crosstab tables record the number (frequency) and percentage of respondents that have the specific characteristics described in the cells of the table. They allow close investigation of the relationships within a set of survey responses that might otherwise not be evident.
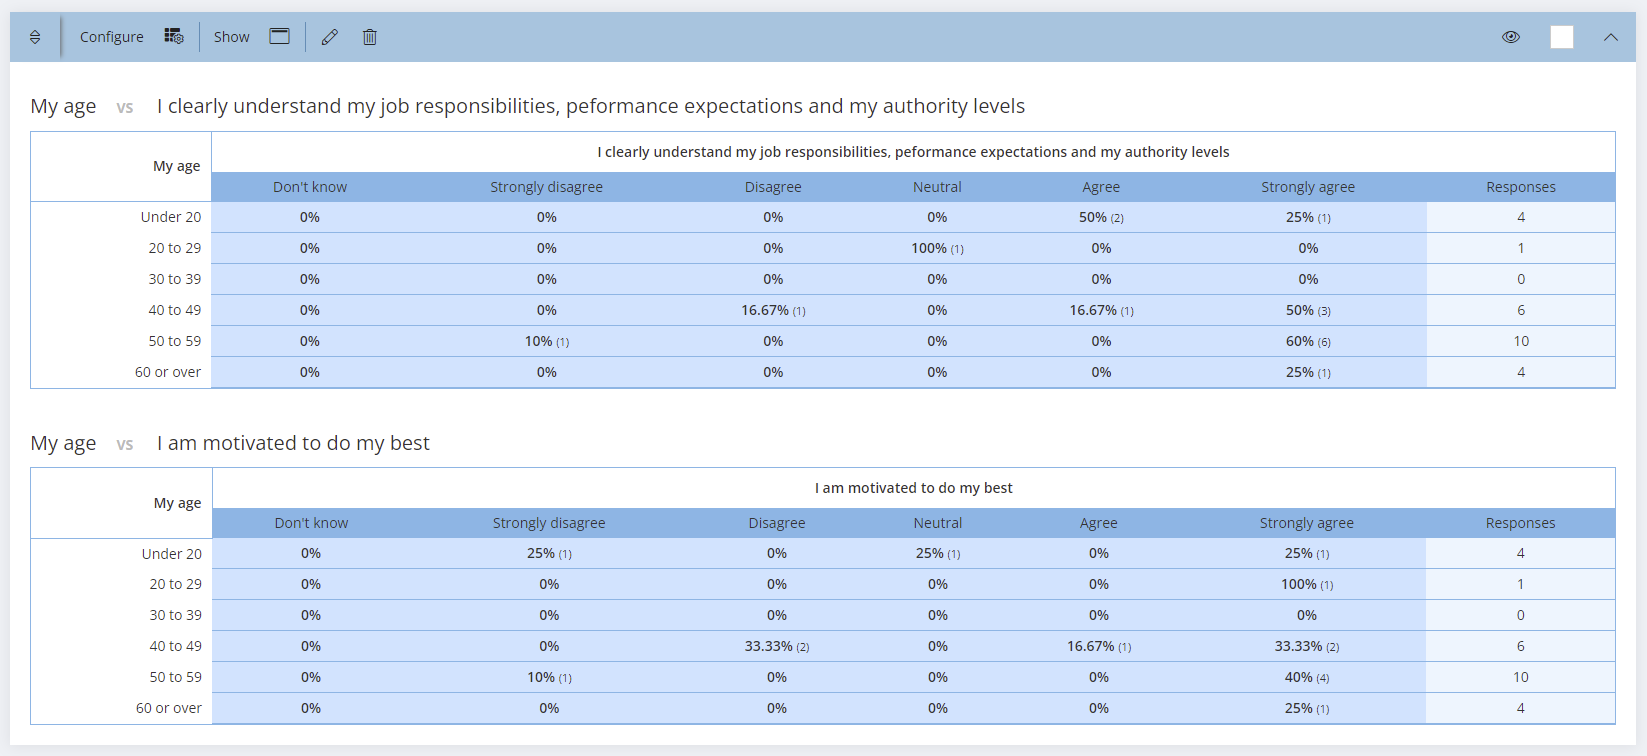
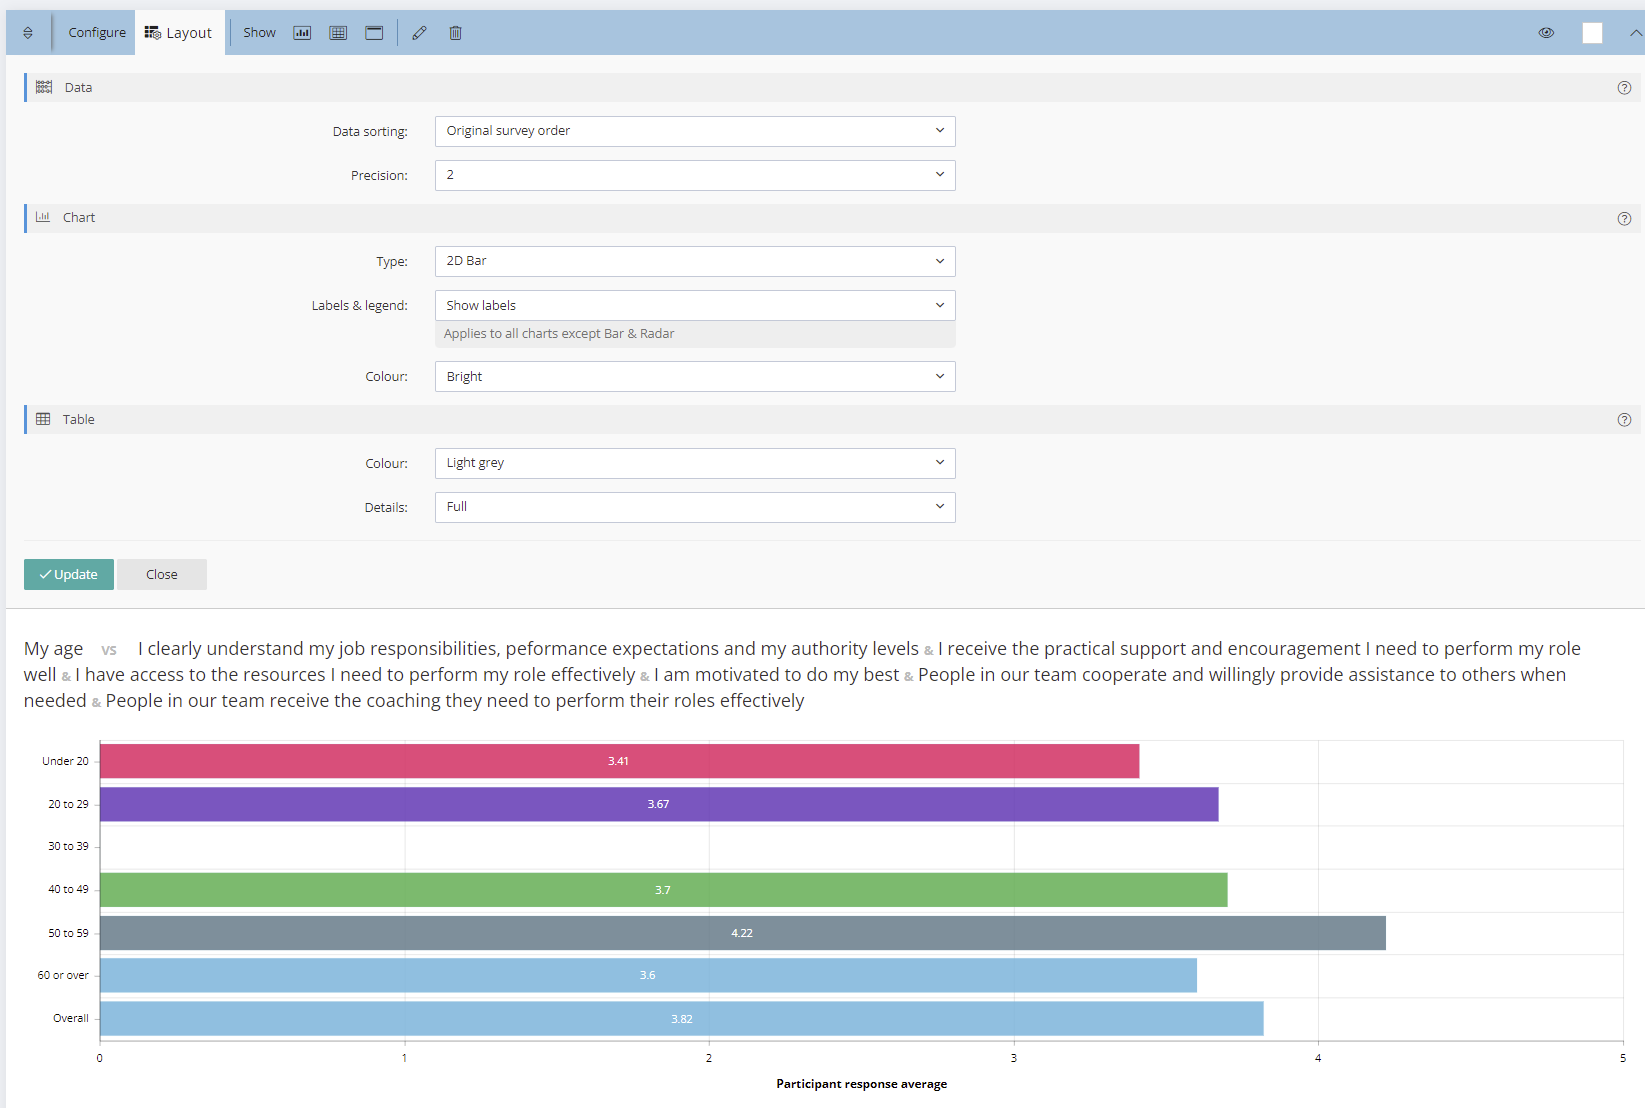
Rating Scale Pivot reports
Rating Scale Pivot reports can be used to compare the responses to a lead multiple choice question against responses to selected rating scale or emoji scale questions.
First select a pivot type (rating scale questions or emoji scale questions). Then select a lead multiple choice question, followed by the target scale and questions. The selected rating scale or emoji scale questions will be presented in charts (with an option to show tables) and present the average for each lead question response option against the scale options. A summary chart will show at the top, followed by charts (and table options) for each Rating Scale question.
A use case example is a 360 degree feedback project. The lead question might be the relationship that a respondent has to the 360 degree feedback recipient (e.g. manager, colleague, direct report, self, other). The target questions could then be about the 360 recipient's performance against the scale for specific expected competency or behaviour questions. The Rating Scale Pivot would present charts and tables showing on average how each relationship group in the lead question responded against the scale for each target question.
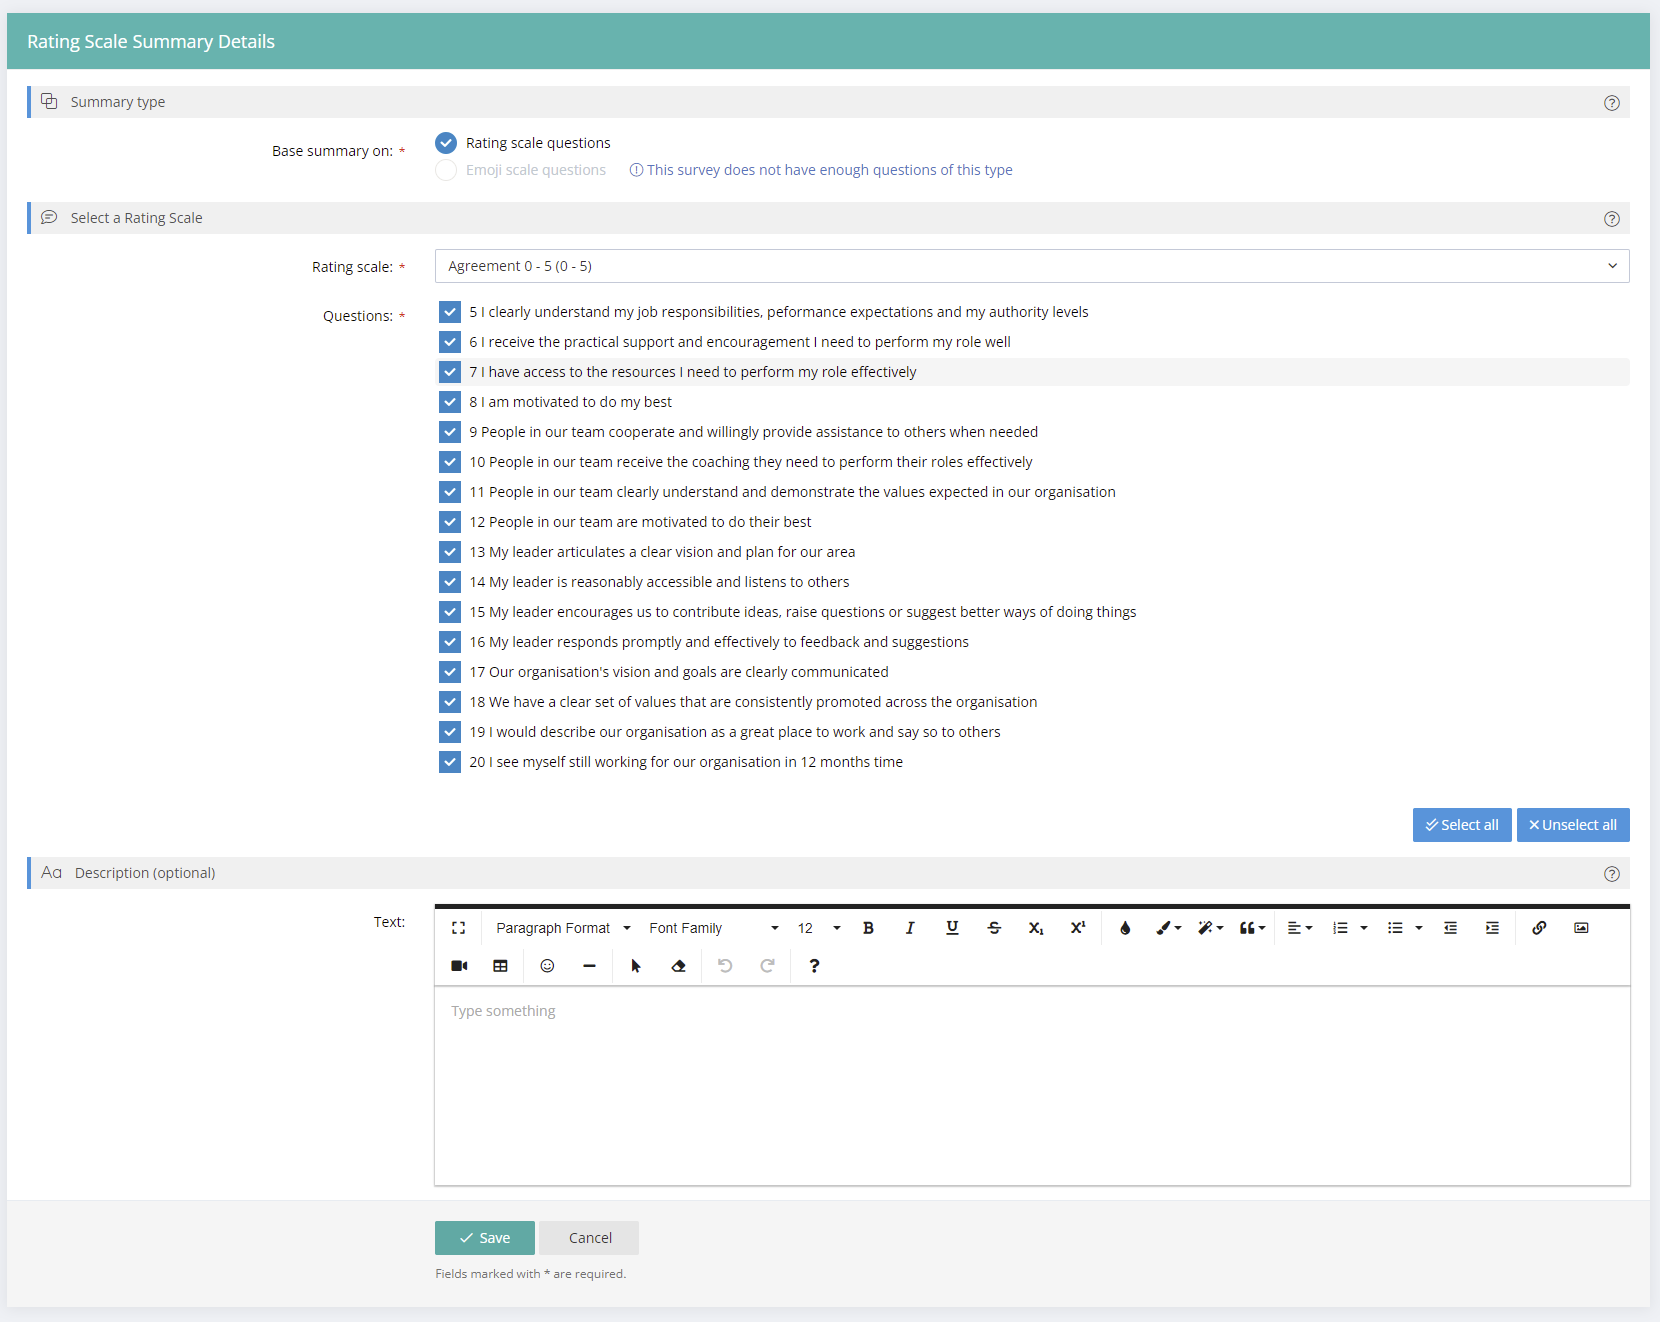
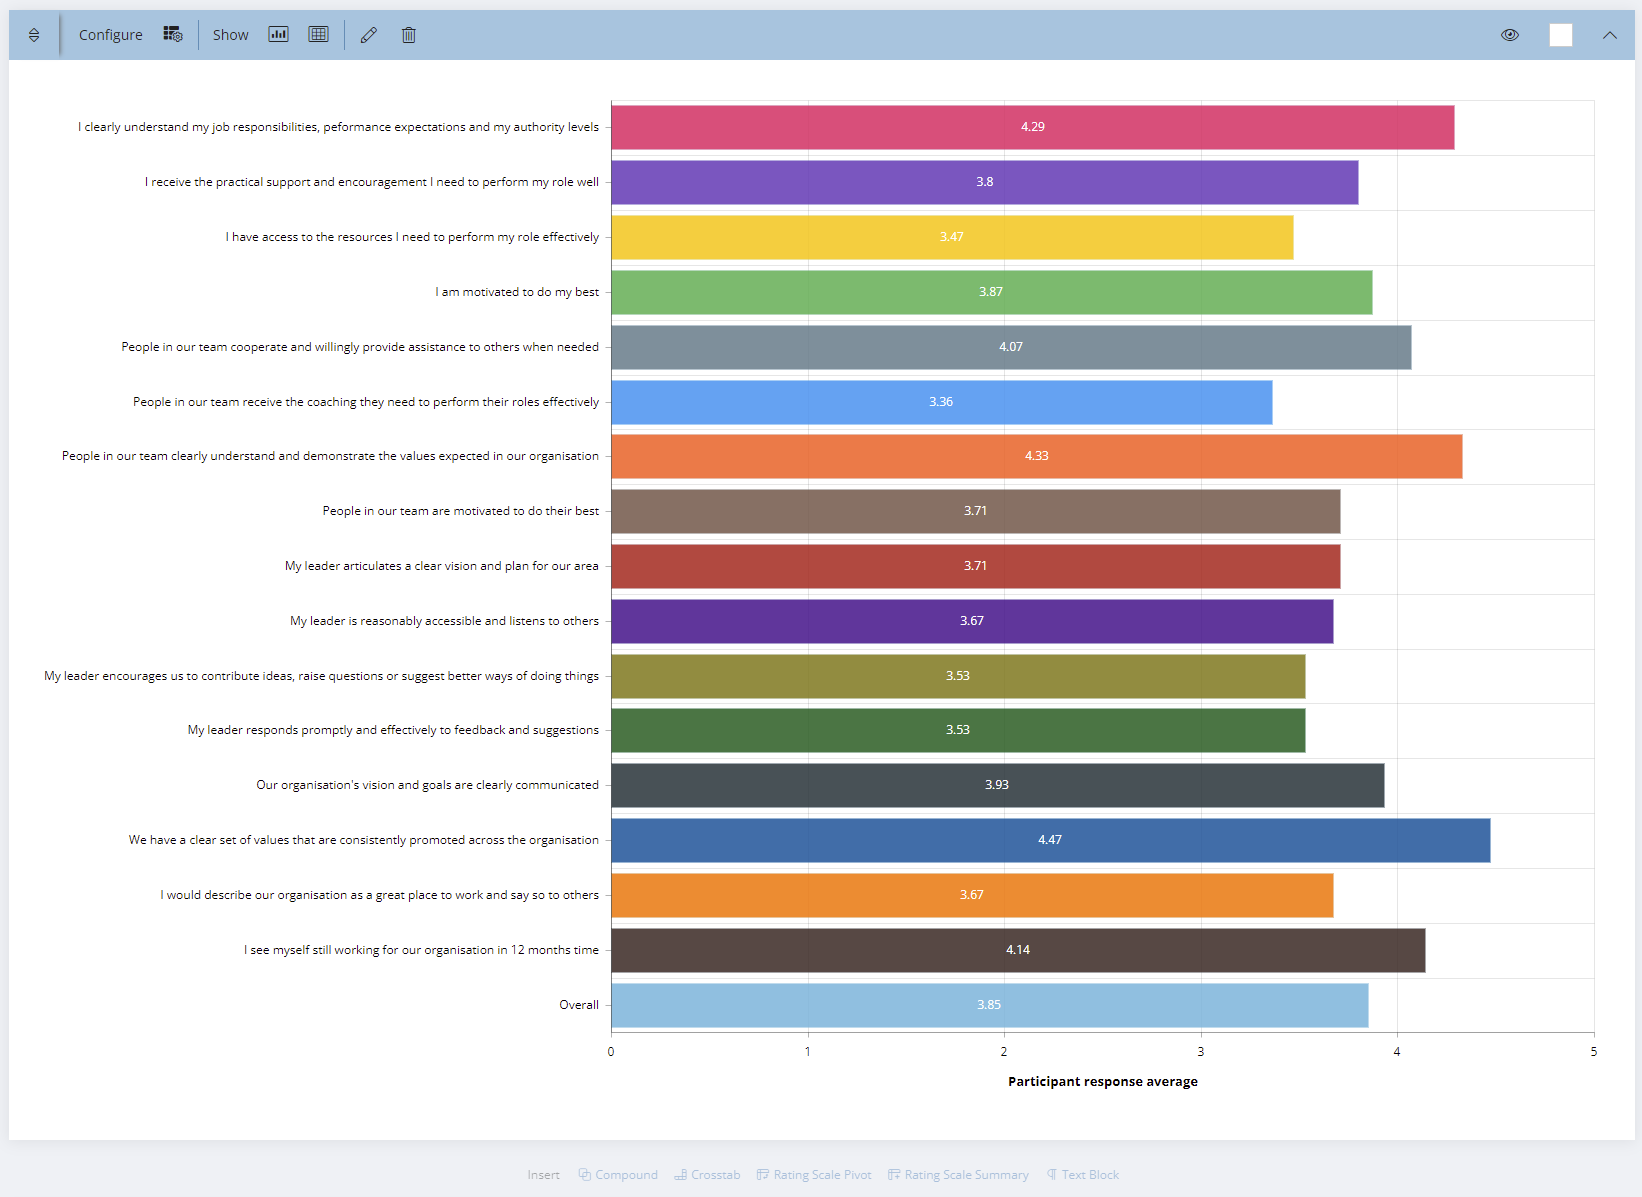
Rating Scale Summary reports
While it is possible to create an overall summary of multiple questions using the Compound feature, sometimes you may want to compare the average data between questions in a single chart. This is where the Rating Scale Summary comes in handy. By selecting a Rating Scale (or Emoji Rating Scale) and two or more questions, you will get an accurate comparison of the responses for the questions, as well as an overall average for all your selections.
Data Precision options
Sometimes very precise numbers matter. To give you optimum flexibility, we've added a Data Precision option to the report items, where you can configure the number of decimal places that data is calculated to. By default this is set to 2, but you can configure it from 0 all the way to 5. You can apply this from the Layout panel in each question, or by using the Defaults panel to apply to selected/all questions in a report.
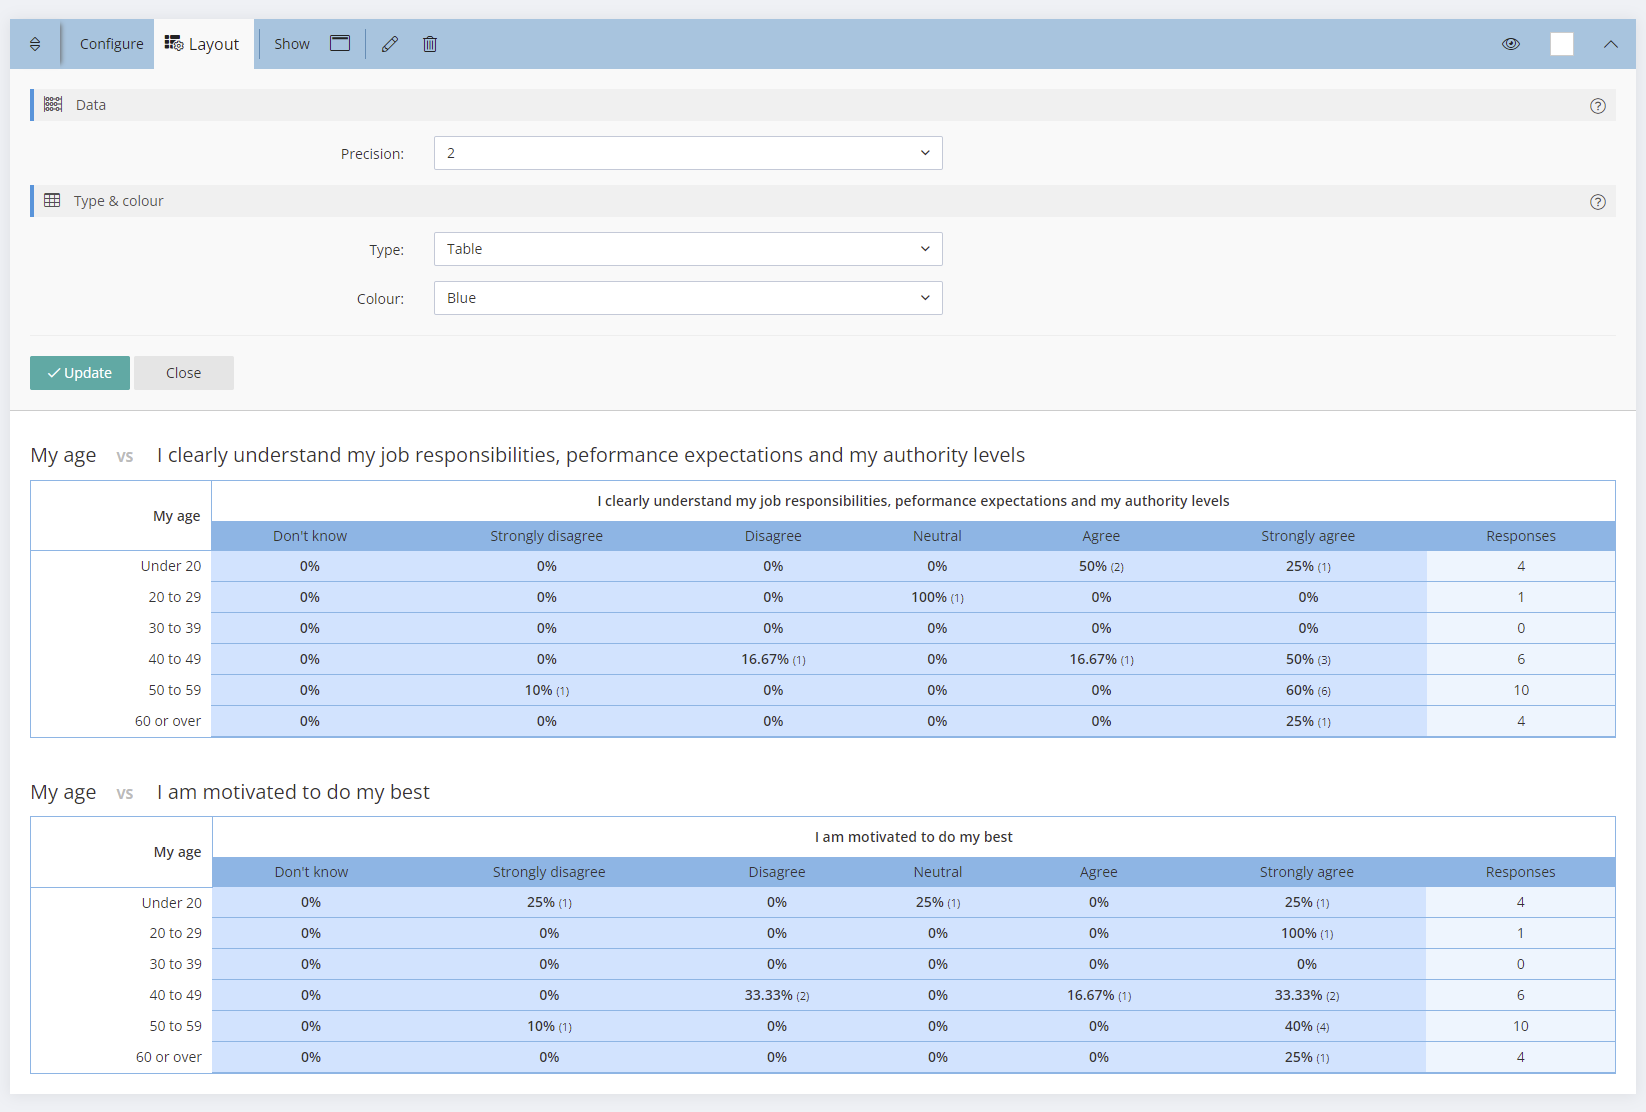
Coloured report table options
To give you even more customisation options when creating reports, we have added a colour selection for the tables generated for each set of results. You can apply this from the Layout panel in each question, or by using the Defaults panel to apply to selected/all questions in a report.
Simplified Report Interface
While previously you had to navigate between up to 3 panels to set display options for each report item (chart, tables & data), all of these settings have now been combined into a single panel, making changes quick & easy.
Adding dynamic report items - Text Blocks, Compounds, Crosstabs, Rating Scale Summaries & Rating Scale Pivots - is now even easier with the new floating toolbars. Between each question panel in your report you will see a set of buttons allowing you to easily insert a new item at that location.

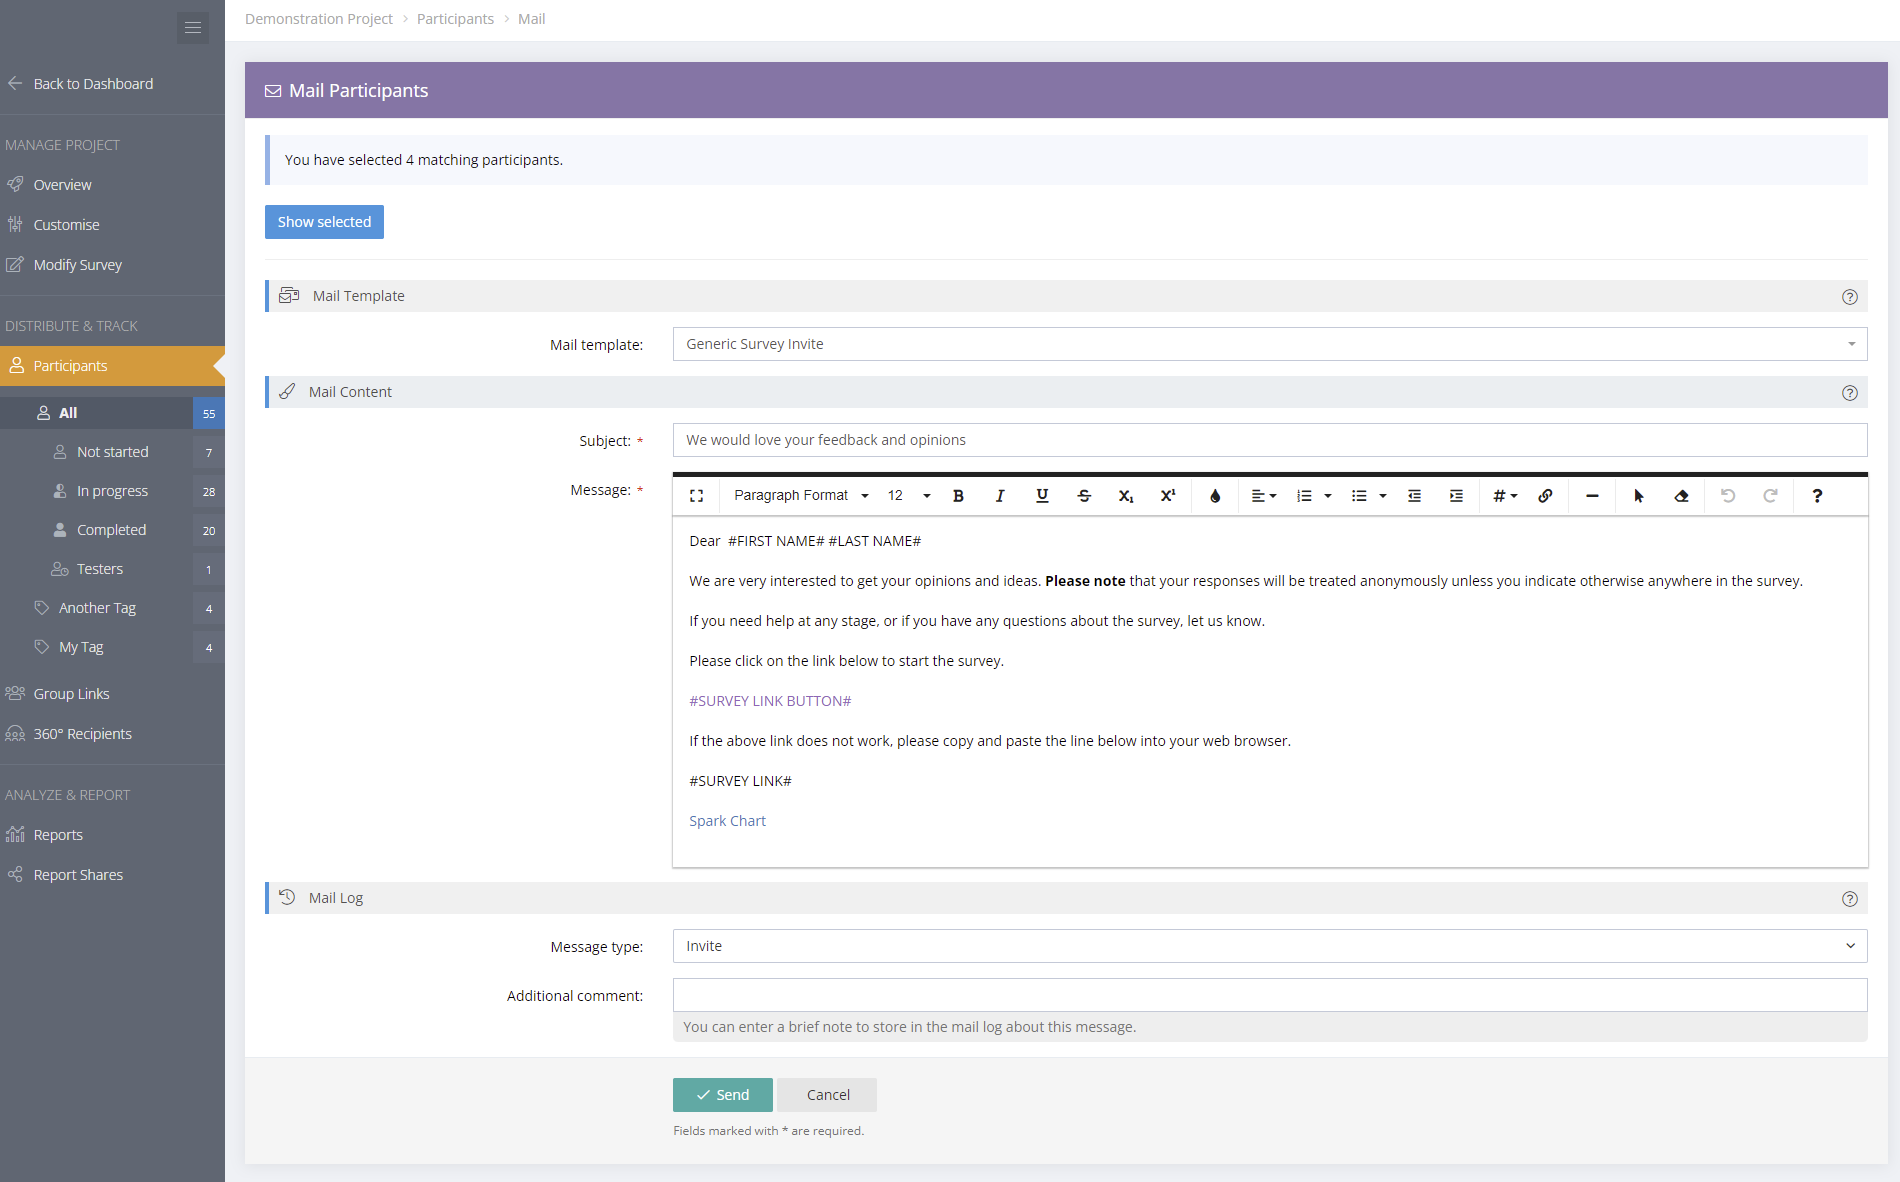
Enhanced Mail Features
We have updated the Mail Participant/Group Link/360 Recipient screen to be easier to navigate. Everything is now presented on a single screen making it easier to use. So that you can keep track of what mail you've sent to each participant, you can now (optionally) specify the type of mail and include an optional comment. This will be saved to the mail log for that participant for future reference.
As sending a large number of emails may take some time, we've also added a progress bar that displays while mail is being sent.
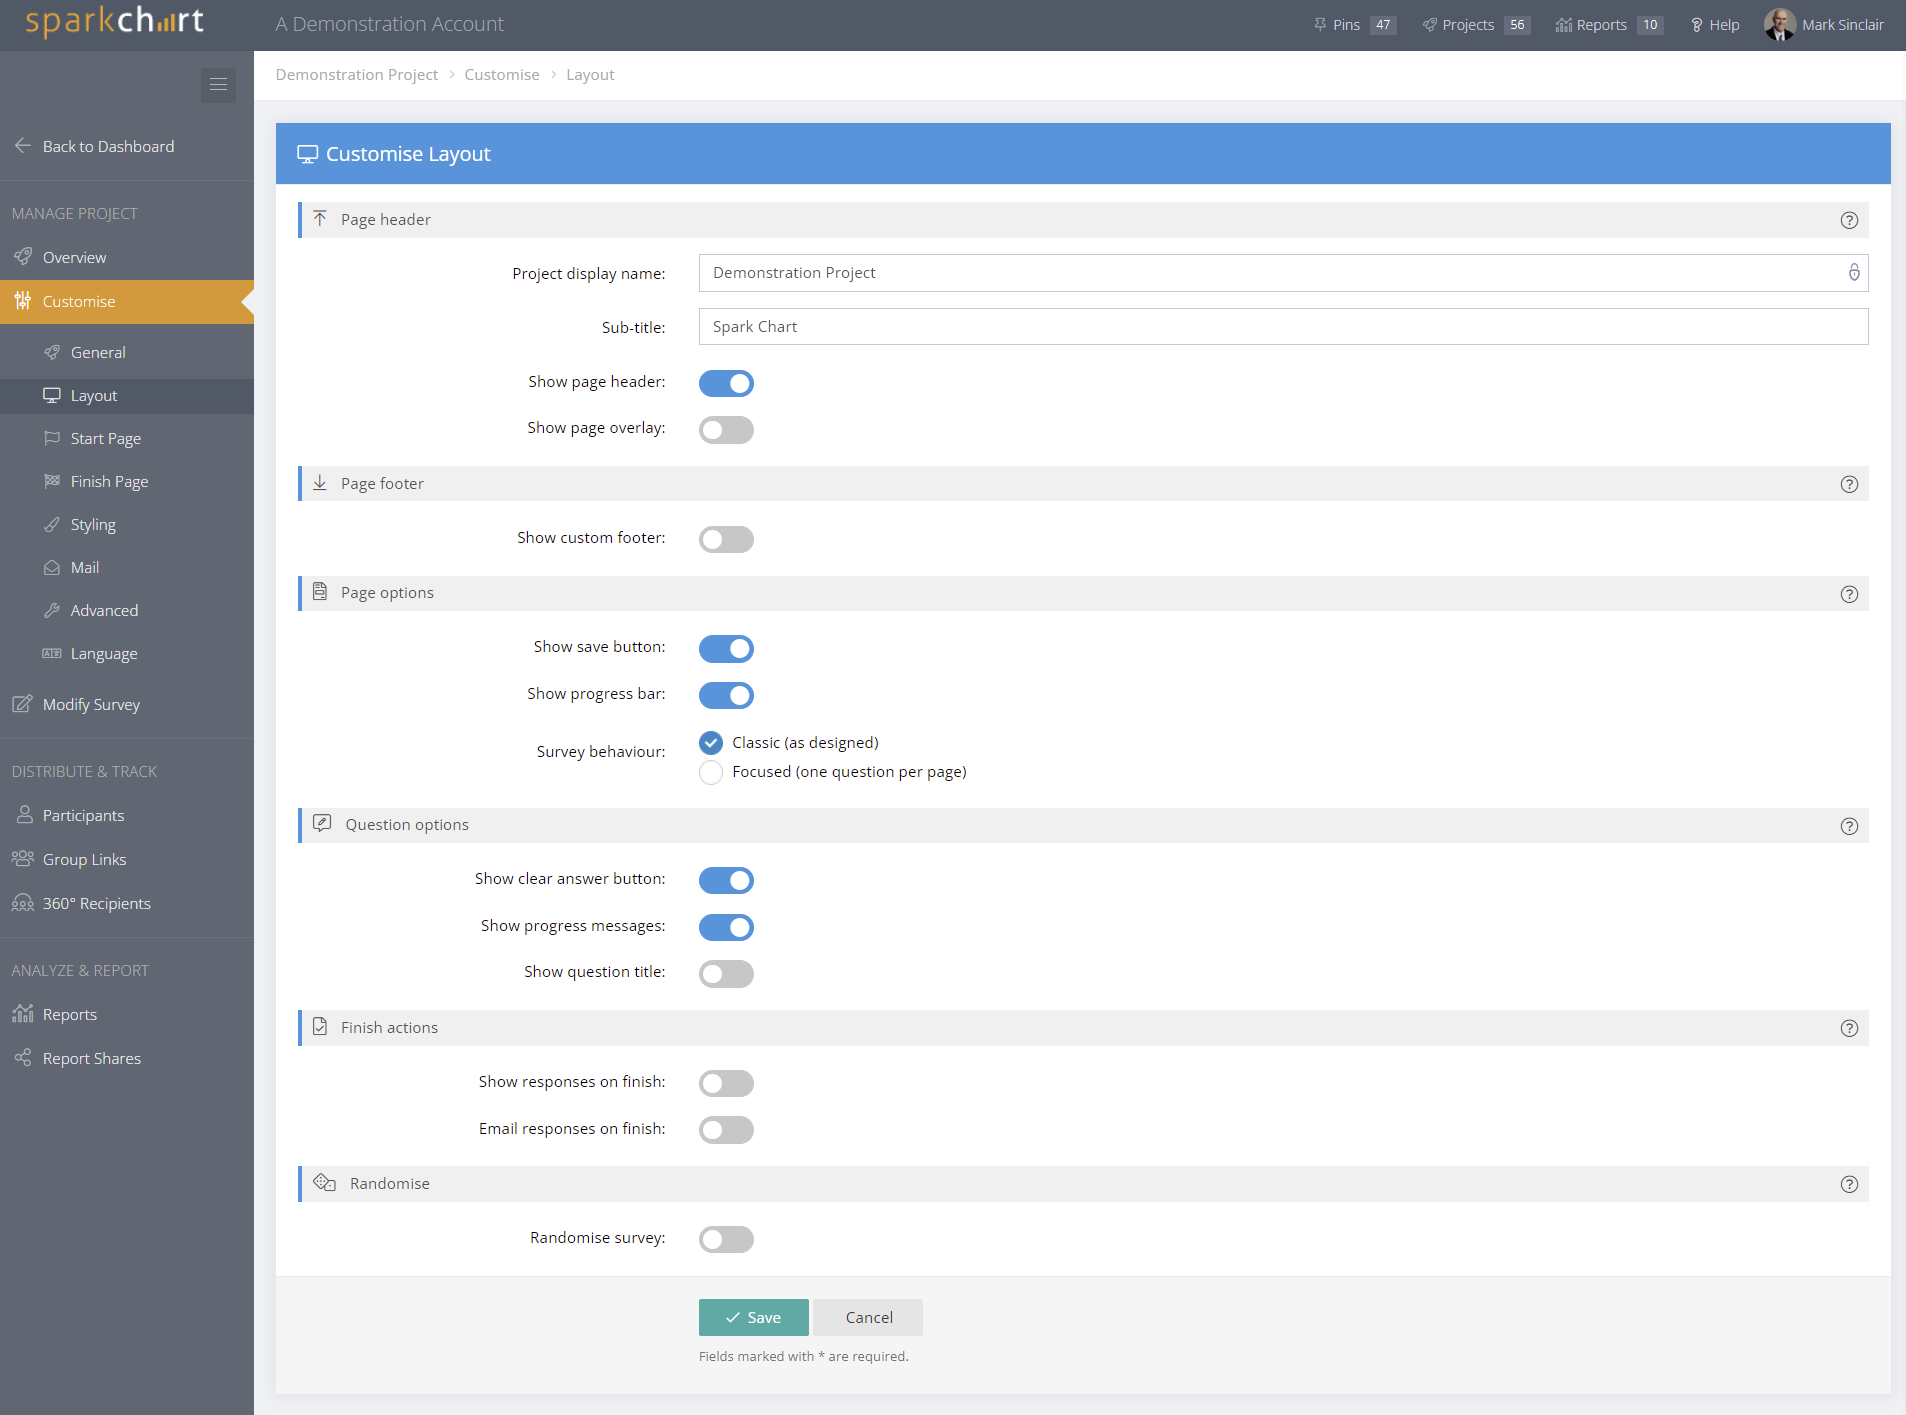
Emailing Survey Responses
When a participant has completed their survey, an option exists to allow them to see what their responses were. Sometimes it may be required that they receive a copy of their responses via email. To facilitate this, we have added a new option to the Project > Customise > Layout screen - "Email responses on finish". If this is set, on completion of a survey, an email will be sent to the participant containing their responses. You may also customise the content of this email by creating a Mail Template in your control panel that contains the new #SURVEY RESPONSES# token, and assign in the Default Send Results mail option in Project > Customise > Mail.
Please note that automatic response mailing is only possible if your Participants have an email address specified in the system, or you've collected this by using a Group Link/360 Recipient registration form.
New Validated Text filter
When creating Validated Text questions, a new Word Count filter has been added where you can specify minimum/maximum or range settings for a question. For example, you may want to create a text question that requires a maximum of 10 words as part of the response.
Archiving Reports & Report Shares
For ongoing surveys, you may find that you have generated a large number of reports and/or report shares that are cluttering up your list. You can now archive these, if you want the option to retrieve them at a later stage.
Copying Group Links & 360 Recipients
Group Links & 360 Recipients now have a "Copy" feature, making it easy to duplicate those items with all their settings intact. This can be particularly useful when working with 360 surveys.
Performance Updates
We have done more work on optimising the loading of reports and surveys, making them even faster.
Mark Sinclair
Co-founder, Spark Chart